Egill Hauksson, Nancy King, Lucy Jones, Sinan Akciz, Karen Feltzer, Bob Dollar, Ken Hudnut, Kate Hutton, Anthony Guarino, Nick Scheckel) Version 1.0
Update – Thursday, September 1st, 2011 – 3:23PM
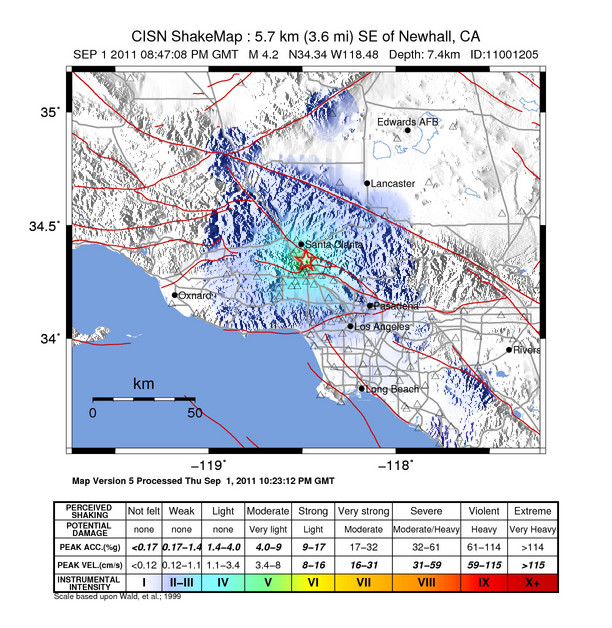
The M4.2 earthquake was located in the northeast corner of the 1994 M6.7 Northridge aftershock zone. Because the 1994 aftershocks have mostly died off, this event is not considered to be an aftershock of the M6.7 event. The last M>4 event in this general region occurred in May 2009, located about 20 miles to the southeast. The M4.2 is located about 10 miles NE of the Northridge event and about 8 miles SW of the San Fernando – Sylmar event. The fault movement was horizontal, on a northwest striking plane. So far, eight aftershocks have occurred with the largest of M3.0 at 2:35 pm.
Magnitude M4 or greater events in the general area since 2000:
| YYYY/MM/DD HH:mm:SS.ss | ET | MAG | M | LAT | LON | DEPTH | Q | EVID | NPH | NGRM |
|---|---|---|---|---|---|---|---|---|---|---|
| 2001/01/14 02:26:14.06 | le | 4.26 | l | 34.284 | -118.404 | 8.8 | A | 9173365 | 177 | 916 |
| 2001/01/14 02:50:53.69 | le | 4.05 | l | 34.289 | -118.403 | 8.4 | A | 9173374 | 173 | 829 |
| 2001/09/09 23:59:18.04 | le | 4.24 | l | 34.059 | -118.388 | 7.9 | A | 9703873 | 140 | 1531 |
| 2002/01/29 05:53:28.93 | le | 4.18 | l | 34.361 | -118.657 | 14.2 | A | 9753485 | 129 | 1596 |
| 2007/08/09 07:58:49.59 | le | 4.66 | l | 34.300 | -118.620 | 7.6 | A | 14312160 | 303 | 2005 |
| 2009/05/02 01:11:13.66 | le | 4.42 | l | 34.067 | -118.882 | 14.2 | A | 10403777 | 179 | 2022 |
| 2011/09/01 20:47:07.75 | le | 4.25 | l | 34.343 | -118.481 | 7.4 | A | 11001205 | 28 | 2199 |
| Modified Mercalli Intensity | I | II-III | IV | V | VI | VII | VIII | IX | X | |
|---|---|---|---|---|---|---|---|---|---|---|
| Est. Population Exposure | 11,839k* | 4,664k | 513k | 44k | 0 | 0 | 0 | 0 | 0 | |
| Perceived Shaking | Not Felt | Weak | Light | Moderate | Strong | Very Strong | Severe | Violent | Extreme | |
| Potential Structure Damage | Resistant | none | none | none | V. Light | Light | Moderate | Moderate/Heavy | Heavy | V. Heavy |
| Vulnerable | none | none | none | Light | Moderate | Moderate/Heavy | Heavy | V. Heavy | V. Heavy | |
*Estimated exposure only includes population within calculated shake map area
Population Exposure
 contours plotted over population per approx. 1 sq km. The regions of integer MMI values are separated by thick contour lines and labeled with Roman numerals. The total population exposure to a given MMI value is obtained by summing the population between the thick contour lines.")
Structure Information Summary
Overall, the population in this region resides in structures that are highly resistant to earthquake shaking, though some vulnerable structures exist.
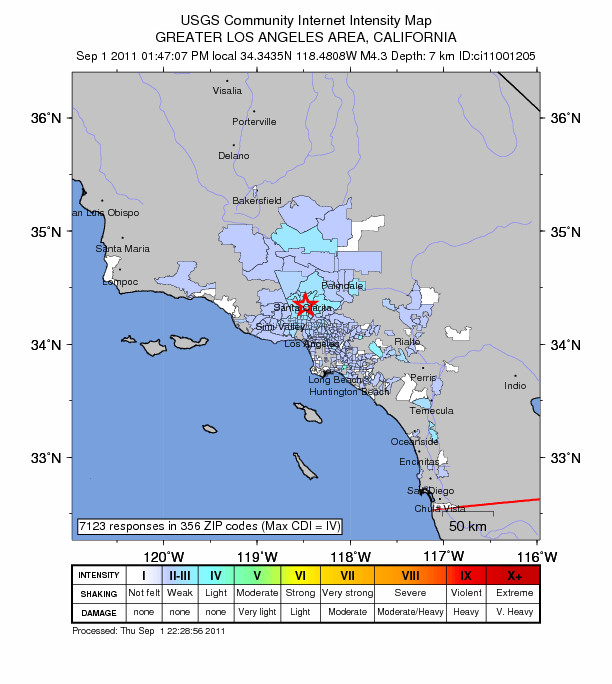
Historical Earthquakes (with MMI)
| Date (UTC) | Dist(km) | Mag | Max MMI(#) | Shaking Deaths |
|---|---|---|---|---|
| 1984-11-26 | 329 | 5.1 | V (17k) | 0 |
| 1994-01-17 | 23 | 6.7 | IX (181k) | 33 |
| 2003-12-22 | 275 | 6.6 | VII (213) | 2 |
Recent earthquakes in this area have caused secondary hazards such as landslides and liquefaction that might have contributed to losses.
Selected Cities Exposed from GeoNames Database of Cities with 1,000 or more residents.
| MMI | City | Population |
|---|---|---|
| IV | Santa Clarita | 169k |
| IV | San Fernando | 25k |
| II | North Glendale | 203k |
| II | Glendale | 195k |
| II | Hollywood | 168k |
| II | Palmdale | 135k |
| I | Los Angeles | 3,695k |
| I | Long Beach | 483k |
| I | Santa Ana | 343k |
| I | Anaheim | 328k |
| I | Riverside | 298k |