SPECIAL REPORT 11:42:15AM 7/29/08
Report by the California Integrated Seismic Network (Caltech/USGS) Egill Hauksson, Kate Hutton, Anthony Guarino, Bob Dollar, Karen Felzter, and Doug Given
Version 03: 2:05 pm 06 August 2008
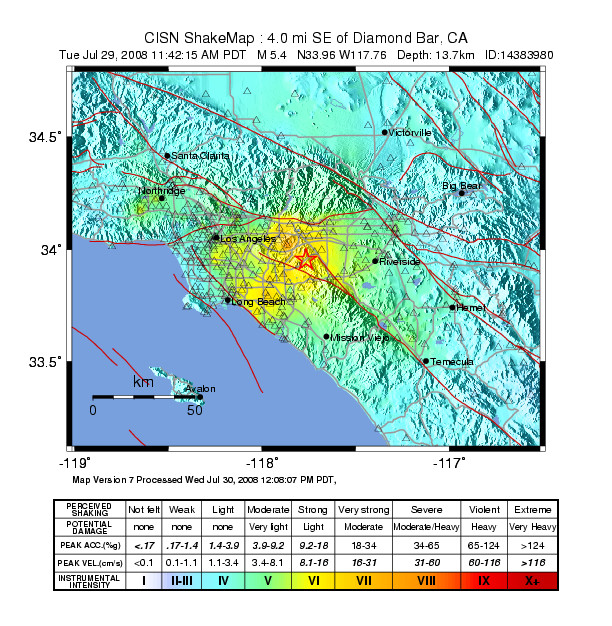
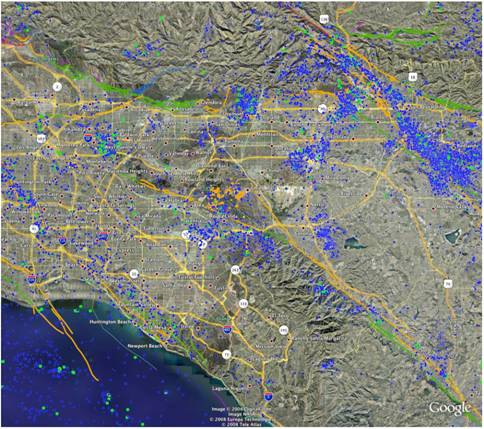
A Mw5.4 main shock-aftershock sequence started 2 miles southwest of Chino Hills, in the Chino Hills at a depth of about 9 miles, in the east Los Angles area at 11:42am on Tuesday, July 29, 2008. The main shock was followed by a M3.8 aftershock at 11:52am. In the first two hours, 37 smaller aftershocks were also recorded in the magnitude range of 1.3 to 2.8. A 2nd M3 aftershock of M3.6 aftershock occurred at 1:41 pm. The sequence was felt across southern California. Strong shaking was reported to the north in the Chino Basin and to the southwest in the Los Angles basin. About 30,000 people had responded as having felt the earthquake, approximately 2 hours following the earthquake.
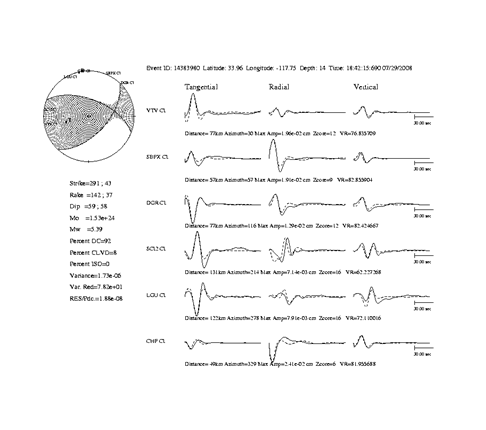
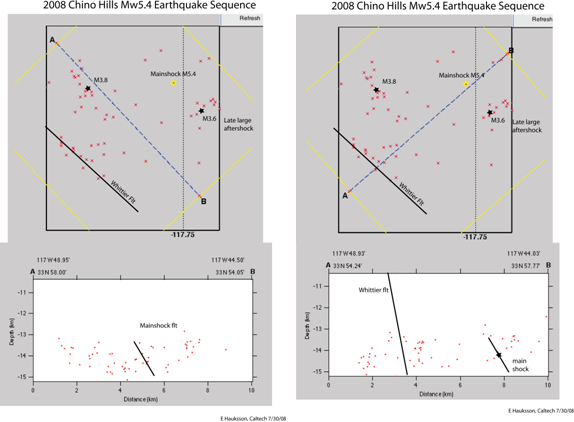
It is not possible to tell at this time what fault caused the earthquake. It is located half-way in between the Whittier and Chino fault. The moment tensor showed a mixture of thrust and left-lateral strike-slip faulting on a plane striking 43 deg east of north, forming a high angle to both faults. This plane has a dip of 58 deg and rake of 43 deg. The preliminary locations of the aftershocks suggest that this is the fault plane. A southwest trend of small earthquakes extending across this region into the Los Angles basin was identified in 1990 and called the Yorba Linda trend. The auxiliary plane has a strike of 291°, dip of 59°, and rake of 142°. This plane has the same strike as the Whittier fault, and day-lights out at the mapped fault. However, the mapped dip of the Whittier fault is 82° while the earthquake has a dip of 59°. Also, the preliminary distribution of aftershock depths does not support the Whittier fault being the causative fault. Further research is needed to determine the causative fault.
This earthquake is similar to the Mw5.9 1 October 1987 Whittier Narrows earthquake, located approximately 18 miles to the northwest. However, the Whittier Narrows main shock was a pure east-west thrust faulting earthquake. Ten miles to the north, the Upland earthquakes that occurred in the early 1990, had left-lateral strike-slip motion. This earthquake occurred on a fault system located to the south of the San Gabriel Mountains and south of the Sierra Madre fault zone. The north edge of the Peninsular Ranges block is deforming as it collides with the San Gabriel mountains block. The zone where we expect this deformation to happen is the Sierra Madre fault zone, instead the deformation is occurring further south, which is also seen in other mountain building regions.
About 5% of earthquake sequences in southern California are foreshock sequences. Thus, it is unlikely that this sequence will be followed immediately, within the next three days, by another, larger sequence. Nonetheless, seismologists will be watching for possible further activity on the Whittier and Chino faults, as well as the Sierra Madre fault, which are the large faults in the region. James W. Dewey of USGS Golden provided the text below:
The greater Los Angeles area earthquake of 29 July 2008, 11:42 PDT (18:42 UTC), was centered in the hills south of Diamond Bar and Chino Hills. An early analysis of the earthquake’s focal mechanism implies that the shock originated as the result of oblique-reverse faulting, in which a block of crust is thrust up and over the crust on the opposite side of the fault and also moves sideways with respect to the crust on the opposite side of the fault. This style of faulting is intermediate between pure reverse faulting and pure strike-slip faulting. The epicenter is in a region of the greater Los Angeles area in which both significant reverse faulting (the Puente Hills thrust) and right-lateral strike-slip faulting (the Whittier fault) have been documented.
The early focal-mechanism is thus consistent with the shock having occurred as the result of stresses similar to those which produced previously mapped faults in the earthquake region. At present, however, the shock has not been associated with a specific geologically mapped fault. The 29 July 2008 earthquake was situated about 30 km east-southeast of the Whittier Narrows earthquake of 1 October 1987, which had a magnitude of 5.9, caused 8 fatalities, and produced over $358 million in damages. The Whittier Narrows earthquake occurred as the result of thrust-faulting (reverse-faulting on a shallowly dipping plane) on the Puente Hills thrust.

The movie below shows the mainshock and aftershock sequence from a 3-D view:
This aftershock sequence has been fairly minor for an event of this magnitude. To date, there have not been any significantly damaging aftershocks, and as time passes, the probability lessens. The aftershock statistics, shown below, demonstrate the current and expected aftershock sequence, based on statistical analysis of previous events. Since this event has had fewer aftershocks following the mainshock than a typical sequence in Southern California, it cannot be assummed that this will continue, nor can the antithesis be assumed either. Aftershock statistics below by Karen Felzer:
The data is better constrained now, and as I suspected the p value is higher. Current stats, as of data downloaded on July 30 at 2:25pm:
- p = 1.0 (C.I. 0.77 to 1.27) (average for Cal = 1.08)
- K = 6.5 (C. I. 2.8 to 12.9; referenced to M>=2 earthquakes) (average for Cal = 16.8)
- Over the next 24 hours (2:25 pm today to 2:25pm tomorrow) expecting:
- 4 M>=2 and 1 M>=2.5 aftershocks, with a 0.4% chance of an M>=5
- Over the next 7 days expecting:
- 13 M>=2 and 4 M>=2.5 with a 1.3% chance of an M>=5
So the p value is approaching the state average and I suspect it may be even closer to it by tomorrow as the catalog becomes more complete, but the K value and overall sequence activity is running at about 40% of average — which agrees very nicely with the fact that the largest aftershock we’ve observed so far is an M 3.8 rather than the average expected M 4.2.
Expectations from the new parameters: