
A major earthquake has been felt throughout Southern California, Arizona, Nevada, and Baja California Norte, Mexico. The Mw7.2 event occurred at 3:40PM PDT, 22:40 UTC, on Sunday, April 4th, 2010. The epicenter was located 30 miles (48 km) SSE of Calexico, CA. The closest town is 11 miles (17.7 km) WSW from the epicenter, located at Guadalupe Victoria, Baja California Norte, Mexico. The fault rupture appears to extend 75 km northwest, from the epicenter in Baja California through the US-Mexico border.
CISN/SCSN Executive Summary (Ken Hudnut, Egill Hauksson, Doug Given, Anthony Guarino, Sue Hough, Kate Hutton, Lucy Jones, Karen Felzer, Bob Dollar)
Version 14 – Posted at 4:40 PM PDT May 5, 2010
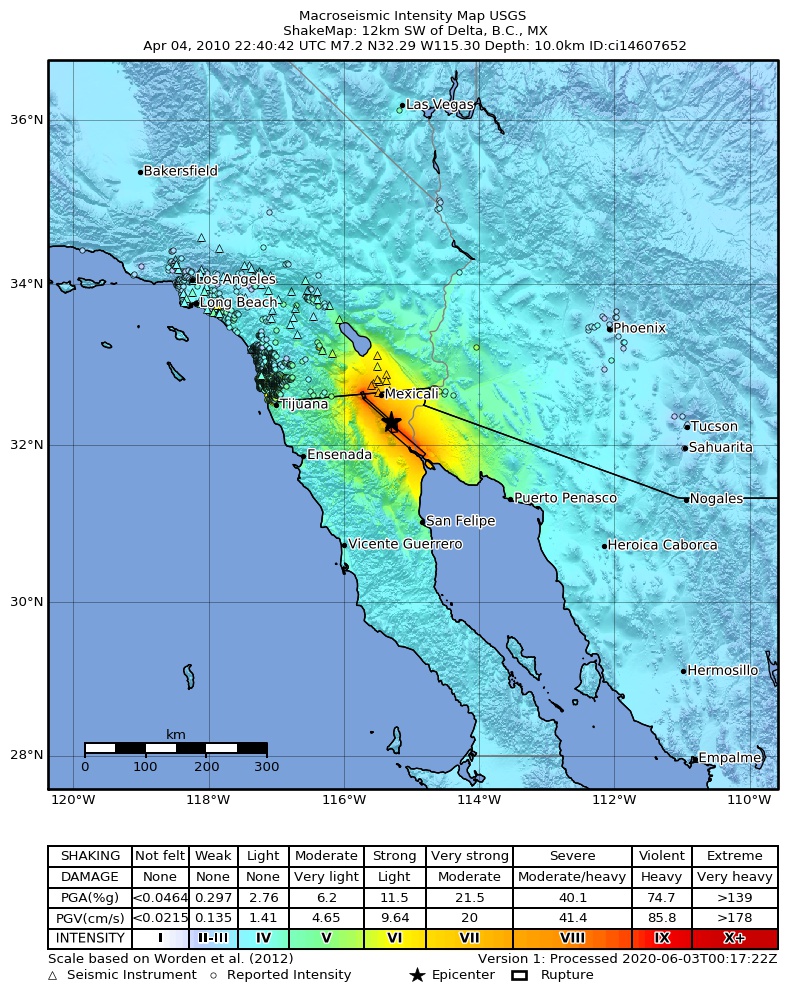
The ground shaking due to the El Mayor – Cucapah earthquake was moderate to heavy in the area near the fault rupture (the area near the dark gray line). Moderate to light shaking was recorded across the San Diego, Imperial, Los Angeles, Riverside, San Bernardino, and Ventura counties. The peak recorded instrumental intensity was 1.1g, recorded at the Salton Sea. 1.1g is a measured intensity in the range of IX, with violent shaking and heavy damage. Click on the above image for the link to the M7.2 ShakeMap.
Update – Wednesday, May 5th, 2010 4:40PM
Several more M3+ events have occurred daily; aftershocks continue as expected. SCSN is currently recording between 150-200 events daily within the aftershock zone.
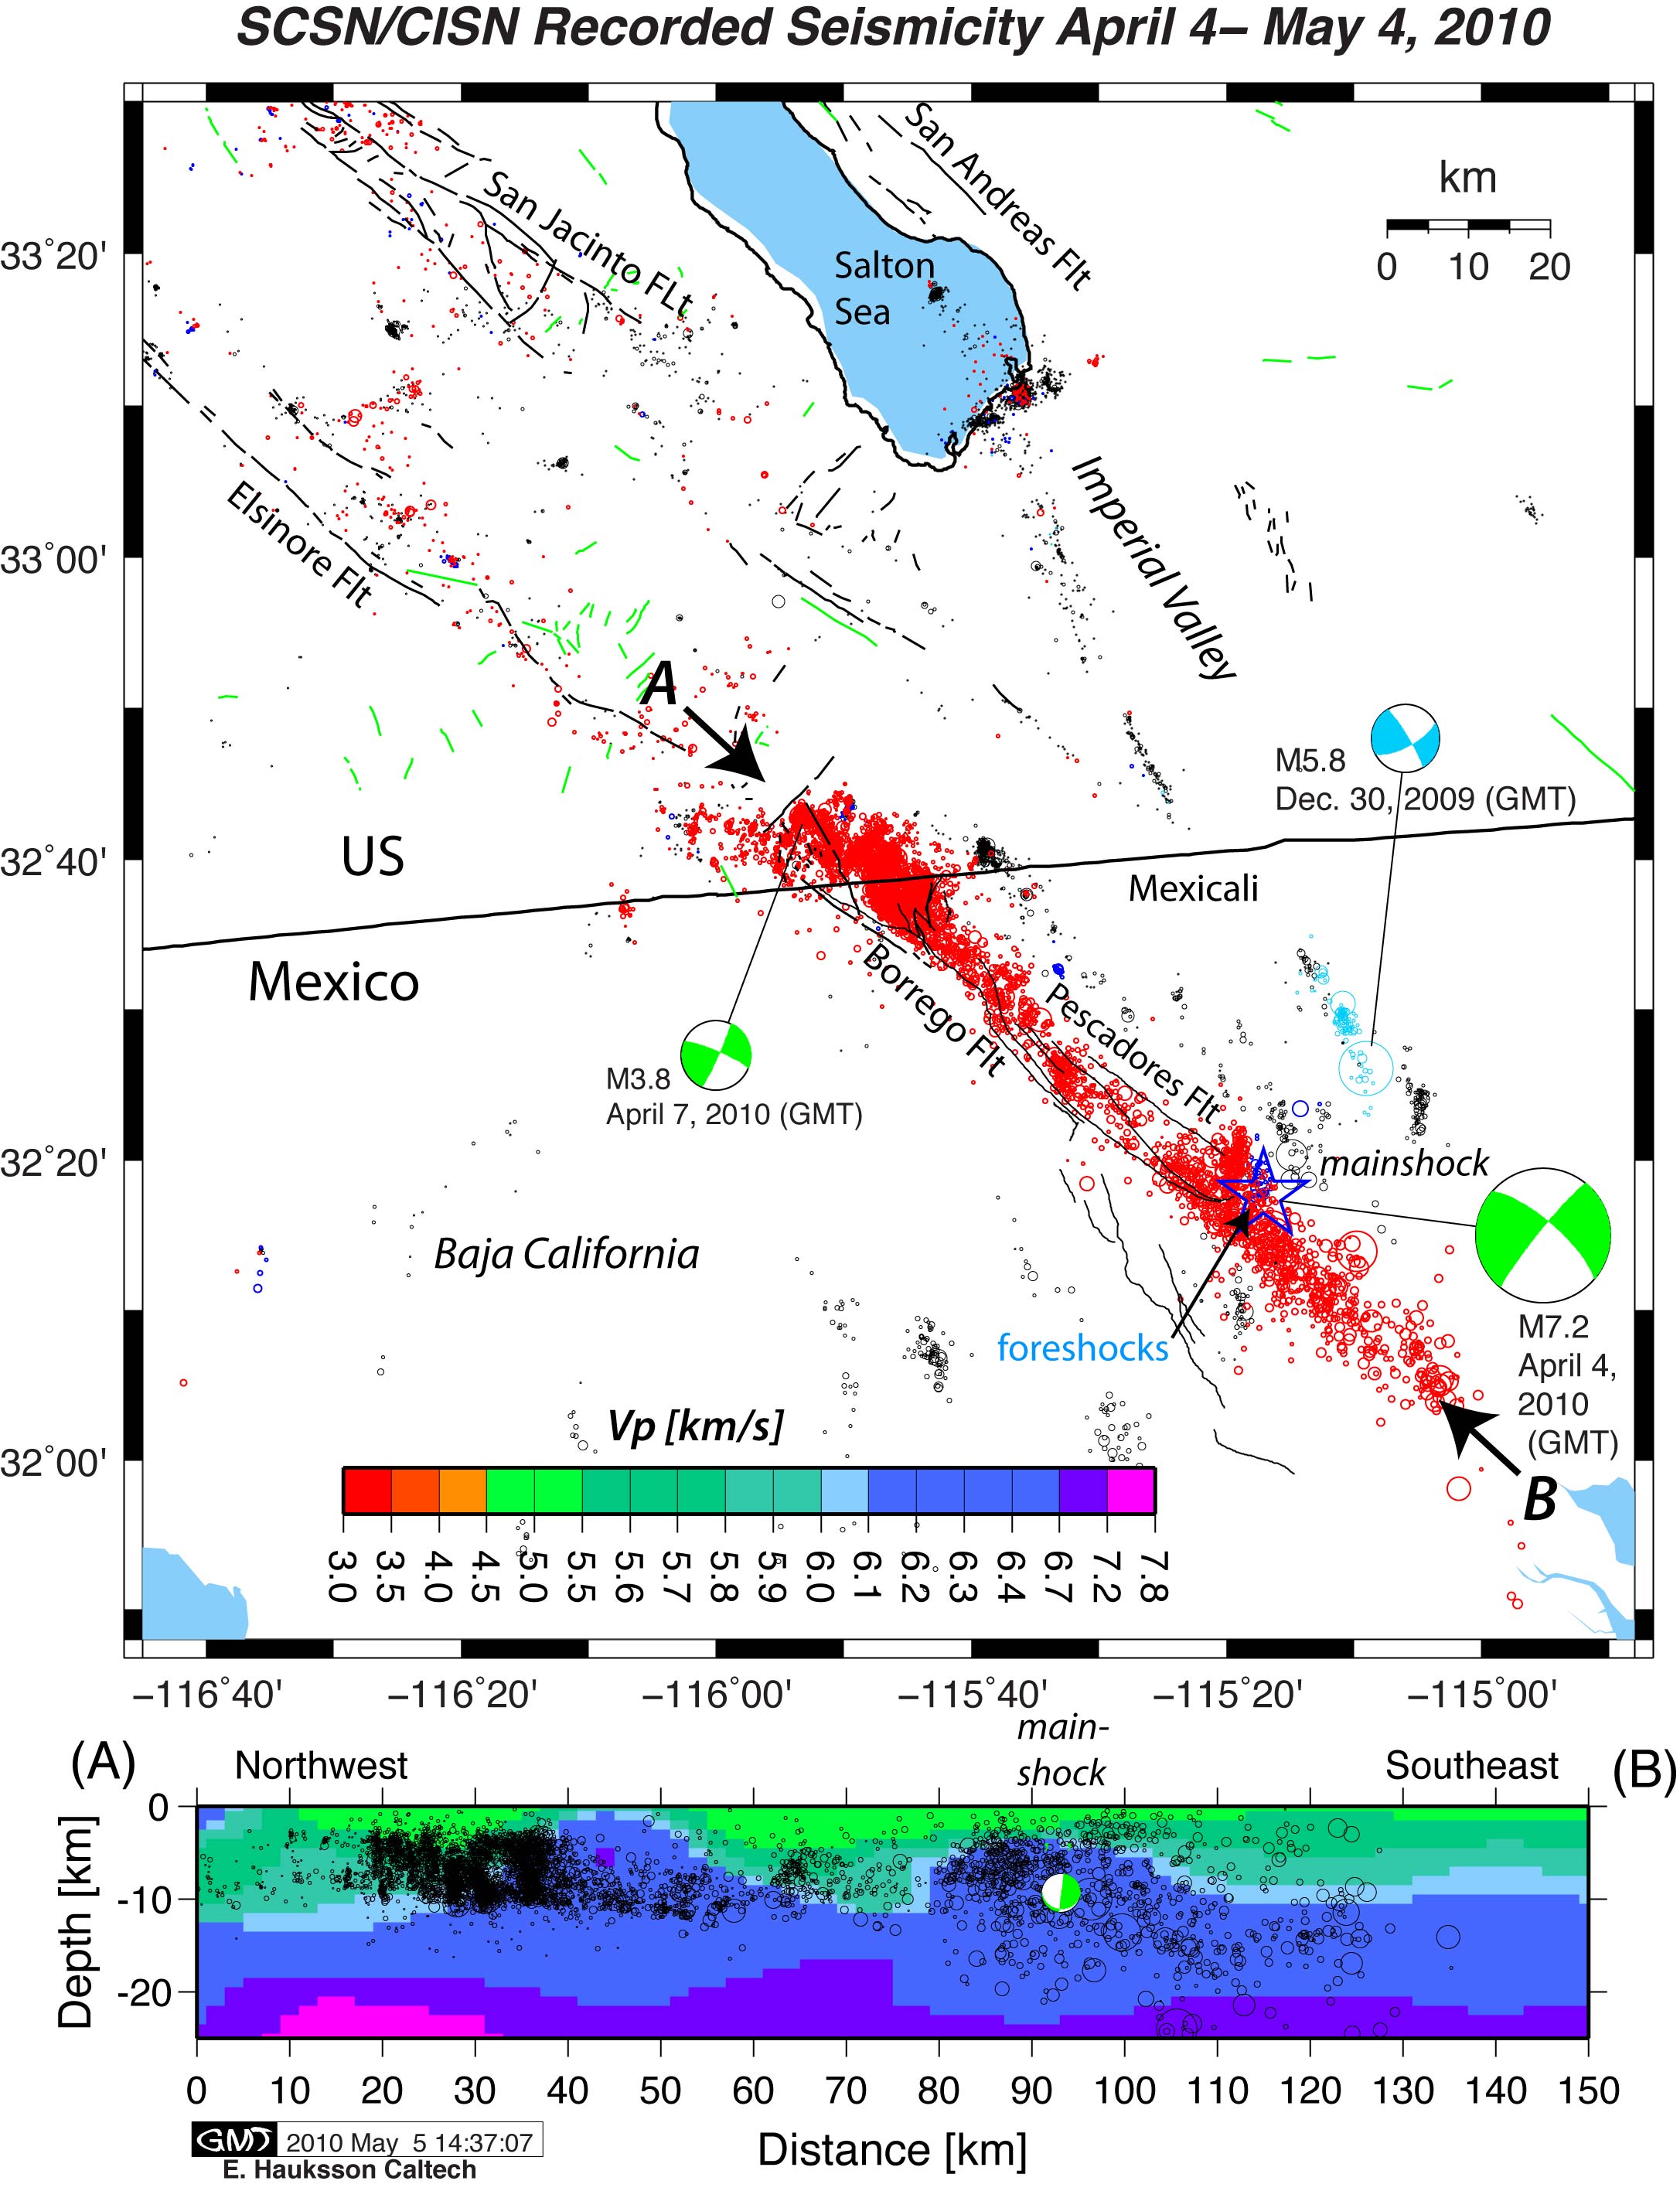
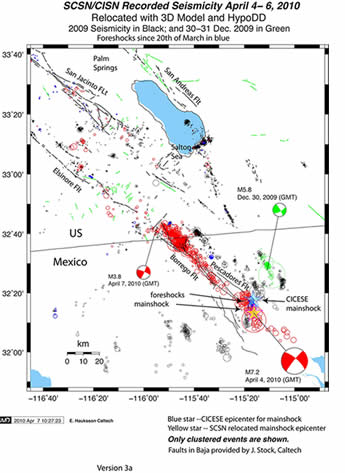
Map and along-strike cross-section of the 2010 Mw7.2 El Mayor-Cucapah earthquake sequence, and related seismicity in 2009. The 2009 seismicity is shown in black, except the M5.8 sequence on Dec.30 to 31 2009 is shown in light blue. The immediate foreshocks (blue) before the M7.2 mainshock are barely visible next to the mainshock, shown as a star. We used a hypoDD and 3D preliminary velocity model, also shown in the cross section. Only the double couple component of the mainshock is shown in map view and cross-section. Digitized faults in Baja were provided by J. Stock.
Update – Monday, May 3rd, 2010 1:40PM
Review of data and post-processing continues, as a backlog of events have occurred within the SCSN database. Analysis will continue, but to date all events >M2.95 have been analyzed. The following table lists all events that have occurred since the mainshock with a magnitude equal to or exceeding M4.0.
| Ev ID | MAG | Date Time | Lat | Lon | Depth | Location |
|---|---|---|---|---|---|---|
| 14607652 | 7.2 | 4/4/2010 15:40:42 | 32 15.5 N | 115 17.2 W | 10 | 50 km (31 mi) SSE of Calexico, CA |
| 31957759 | 5.5 | 4/4/2010 15:50:17 | 32 5.8 N | 115 2.8 W | 10 | 76 km (47 mi) SSE of Calexico, CA |
| 14607836 | 5.4 | 4/4/2010 16:15:14 | 32 18 N | 115 15.6 W | 10 | 46 km (29 mi) SSE of Calexico, CA |
| 14607924 | 5.4 | 4/4/2010 16:25:06 | 32 14.8 N | 115 17.9 W | 10 | 50 km (31 mi) SSE of Calexico, CA |
| 14608220 | 5.3 | 4/4/2010 17:07:09 | 32 1.1 N | 115 1 W | 10 | 84 km (52 mi) SSW of Yuma, AZ |
| 10589037 | 5.3 | 4/8/2010 9:44:25 | 32 13.2 N | 115 16.6 W | 10 | 54 km (33 mi) SSE of Calexico, CA |
| 14609660 | 5.0 | 4/4/2010 20:15:24 | 32 37.7 N | 115 48.4 W | 0.1 | 21 km (13 mi) SE of Ocotillo, C A |
| 14612516 | 4.9 | 4/5/2010 4:14:14 | 32 39.8 N | 115 48.5 W | 13.6 | 19 km (12 mi) ESE of Ocotillo, CA |
| 14607820 | 4.8 | 4/4/2010 16:09:40 | 32 12.2 N | 115 20 W | 10 | 54 km (33 mi) SSE of Calexico, CA |
| 10612285 | 4.8 | 4/15/2010 3:20:47 | 32 7.1 N | 115 2.8 W | 10 | 74 km (46 mi) SE of Calexico, C A |
| 14682004 | 4.8 | 4/27/2010 3:55:35 | 32 40.9 N | 115 50.1 W | 14.4 | 16 km (10 mi) ESE of Ocotillo, CA |
| 14607972 | 4.7 | 4/4/2010 16:37:33 | 32 27.7 N | 115 35.8 W | 10 | 25 km (15 mi) SSW of Calexico, CA |
| 14613212 | 4.7 | 4/5/2010 6:33:05 | 32 38.4 N | 115 48.1 W | 0 | 21 km (13 mi) ESE of Ocotillo, CA |
| 14618236 | 4.7 | 4/6/2010 1:12:24 | 31 51.7 N | 115 0.9 W | 10 | 100 km (62 mi) SSW of Yuma, AZ |
| 10595133 | 4.7 | 4/9/2010 16:05:42 | 32 13.1 N | 115 14.4 W | 10 | 55 km (34 mi) SSE of Calexico, CA |
| 30213759 | 4.6 | 4/4/2010 18:25:34 | 32 9.5 N | 115 6.3 W | 6 | 68 km (42 mi) SSE of Calexico, CA |
| 14616380 | 4.6 | 4/5/2010 18:22:57 | 32 4.5 N | 114 57.6 W | 10 | 76 km (47 mi) SSW of Yuma, AZ |
| 14617100 | 4.6 | 4/5/2010 21:12:21 | 32 35.4 N | 115 46.1 W | 4.6 | 27 km (17 mi) SE of Ocotillo, C A |
| 14618772 | 4.6 | 4/6/2010 3:06:36 | 32 37.1 N | 115 47.6 W | 4.4 | 23 km (14 mi) SE of Ocotillo, C A |
| 10602453 | 4.6 | 4/11/2010 9:42:03 | 32 15.3 N | 115 19.2 W | 10 | 49 km (30 mi) SSE of Calexico, CA |
| 10629213 | 4.6 | 4/22/2010 7:22:03 | 32 40.1 N | 115 48.7 W | 3 | 19 km (12 mi) ESE of Ocotillo, CA |
| 10629477 | 4.6 | 4/22/2010 10:12:12 | 32 39.4 N | 115 48.5 W | 6 | 19 km (12 mi) ESE of Ocotillo, CA |
| 30389759 | 4.5 | 4/4/2010 19:47:27 | 32 15.4 N | 115 14.6 W | 10 | 52 km (32 mi) SSE of Calexico, CA |
| 14616484 | 4.5 | 4/5/2010 18:58:14 | 32 16.8 N | 115 20.8 W | 10 | 45 km (28 mi) SSE of Calexico, CA |
| 14623804 | 4.5 | 4/6/2010 22:21:25 | 32 43.9 N | 115 54.4 W | 0.4 | 8 km (5 mi) E of Ocotillo, CA |
| 14624220 | 4.5 | 4/6/2010 23:36:26 | 32 1.8 N | 114 56.5 W | 10 | 80 km (50 mi) SSW of Yuma, AZ |
| 10585381 | 4.5 | 4/7/2010 19:47:56 | 32 39.4 N | 115 45.7 W | 1.2 | 23 km (15 mi) ESE of Ocotillo, CA |
| 10588789 | 4.5 | 4/8/2010 8:44:58 | 32 35.4 N | 115 46.1 W | 2.3 | 26 km (16 mi) SE of Ocotillo, C A |
| 10597061 | 4.5 | 4/10/2010 2:12:28 | 32 40.2 N | 115 46.4 W | 6.8 | 22 km (14 mi) ESE of Ocotillo, CA |
| 10612165 | 4.5 | 4/15/2010 2:20:36 | 31 56.3 N | 115 3.5 W | 10 | 91 km (57 mi) SSE of Calexico, CA |
| 14607956 | 4.4 | 4/4/2010 16:33:12 | 32 16.6 N | 115 21.9 W | 10 | 45 km (28 mi) SSE of Calexico, CA |
| 14608980 | 4.4 | 4/4/2010 18:52:25 | 32 36.5 N | 115 46 W | 12.6 | 26 km (16 mi) ESE of Ocotillo, CA |
| 30237759 | 4.4 | 4/4/2010 20:11:01 | 32 5 N | 114 59.9 W | 6 | 77 km (48 mi) SSW of Yuma, AZ |
| 14609924 | 4.4 | 4/4/2010 20:32:06 | 32 10.5 N | 115 14.8 W | 33.3 | 60 km (37 mi) SSE of Calexico, CA |
| 14623588 | 4.4 | 4/6/2010 21:23:42 | 31 51.1 N | 114 55.8 W | 10 | 98 km (61 mi) SSW of Yuma, AZ |
| 30461759 | 4.4 | 4/6/2010 22:21:41 | 32 42.3 N | 115 53.7 W | 5.6 | 10 km (6 mi) ESE of Ocotillo, CA |
| 10610941 | 4.4 | 4/14/2010 15:34:54 | 32 11.6 N | 115 12.8 W | 10 | 59 km (37 mi) SSE of Calexico, CA |
| 31829759 | 4.4 | 4/15/2010 2:21:37 | 31 60 N | 115 2.3 W | 10 | 86 km (53 mi) SSE of Calexico, CA |
| 14686028 | 4.4 | 4/29/2010 10:51:15 | 32 35.3 N | 115 46.1 W | 10 | 27 km (17 mi) SE of Ocotillo, C A |
| 14609500 | 4.3 | 4/4/2010 19:54:34 | 32 27.6 N | 115 37.9 W | 6 | 26 km (16 mi) SSW of Calexico, CA |
| 14610172 | 4.3 | 4/4/2010 21:10:14 | 32 25.2 N | 115 32.6 W | 6 | 28 km (17 mi) S of Calexico, CA |
| 14622036 | 4.3 | 4/6/2010 15:09:09 | 32 36.2 N | 115 44.3 W | 1.4 | 24 km (15 mi) WSW of Calexico, CA |
| 14608484 | 4.2 | 4/4/2010 17:42:39 | 32 16.1 N | 115 18.8 W | 6 | 48 km (30 mi) SSE of Calexico, CA |
| 14608660 | 4.2 | 4/4/2010 17:58:50 | 32 14.1 N | 115 19.5 W | 10 | 51 km (32 mi) SSE of Calexico, CA |
| 14608692 | 4.2 | 4/4/2010 18:06:40 | 32 14.8 N | 115 25.6 W | 10 | 47 km (29 mi) S of Calexico, CA |
| 14610940 | 4.2 | 4/4/2010 23:17:00 | 32 36.6 N | 115 47.9 W | 10 | 23 km (14 mi) SE of Ocotillo, C A |
| 14611332 | 4.2 | 4/5/2010 0:15:32 | 32 10.2 N | 115 19.8 W | 10 | 58 km (36 mi) SSE of Calexico, CA |
| 14613932 | 4.2 | 4/5/2010 9:25:48 | 32 9.3 N | 115 15.2 W | 7 | 61 km (38 mi) SSE of Calexico, CA |
| 10584821 | 4.2 | 4/7/2010 17:25:38 | 32 15.3 N | 115 15.7 W | 33.5 | 51 km (32 mi) SSE of Calexico, CA |
| 10591725 | 4.2 | 4/8/2010 22:32:14 | 32 12.1 N | 115 18.4 W | 32.2 | 55 km (34 mi) SSE of Calexico, CA |
| 10594757 | 4.2 | 4/9/2010 13:53:26 | 32 17.1 N | 115 21.6 W | 10 | 44 km (28 mi) SSE of Calexico, CA |
| 10602797 | 4.2 | 4/11/2010 12:13:48 | 32 0.8 N | 115 4.7 W | 10 | 83 km (51 mi) SSE of Calexico, CA |
| 10618341 | 4.2 | 4/17/2010 9:09:53 | 32 16.5 N | 115 20.1 W | 6 | 46 km (29 mi) SSE of Calexico, CA |
| 10622405 | 4.2 | 4/18/2010 21:26:08 | 32 41.1 N | 115 51.4 W | 10 | 14 km (9 mi) ESE of Ocotillo, CA |
| 10627653 | 4.2 | 4/21/2010 3:37:14 | 32 31.6 N | 115 36.6 W | 22.6 | 19 km (12 mi) SW of Calexico, C A |
| 14607964 | 4.1 | 4/4/2010 16:34:28 | 32 35.9 N | 115 45.3 W | 6.7 | 26 km (16 mi) WSW of Calexico, CA |
| 14608004 | 4.1 | 4/4/2010 16:42:57 | 32 7.1 N | 115 1.4 W | 10 | 74 km (46 mi) SSW of Yuma, AZ |
| 14608252 | 4.1 | 4/4/2010 17:15:31 | 32 14.2 N | 115 11.1 W | 10 | 56 km (35 mi) SSE of Calexico, CA |
| 30333759 | 4.1 | 4/4/2010 18:42:50 | 32 7.2 N | 115 10.2 W | 10 | 68 km (42 mi) SSE of Calexico, CA |
| 14616212 | 4.1 | 4/5/2010 17:56:39 | 32 0.5 N | 115 13.2 W | 10 | 78 km (48 mi) SSE of Calexico, CA |
| 14620452 | 4.1 | 4/6/2010 9:23:58 | 32 15.1 N | 115 17.7 W | 10 | 50 km (31 mi) SSE of Calexico, CA |
| 14620676 | 4.1 | 4/6/2010 10:31:16 | 32 2.3 N | 115 4.4 W | 10 | 80 km (50 mi) SSE of Calexico, CA |
| 10590725 | 4.1 | 4/8/2010 17:19:00 | 32 16.9 N | 115 22.8 W | 28.5 | 44 km (28 mi) SSE of Calexico, CA |
| 10609773 | 4.1 | 4/14/2010 4:19:59 | 32 39.9 N | 115 46.8 W | 1 | 21 km (13 mi) ESE of Ocotillo, CA |
| 14607700 | 4.0 | 4/4/2010 15:54:13 | 32 26.2 N | 115 29.8 W | 10 | 26 km (16 mi) S of Calexico, CA |
| 14607852 | 4.0 | 4/4/2010 16:19:31 | 32 35.5 N | 115 44.8 W | 10 | 25 km (16 mi) WSW of Calexico, CA |
| 14607876 | 4.0 | 4/4/2010 16:19:32 | 32 37.2 N | 115 44.4 W | 10 | 24 km (15 mi) WSW of Calexico, CA |
| 30317767 | 4.0 | 4/4/2010 16:44:43 | 32 18.6 N | 115 21.9 W | 10 | 42 km (26 mi) SSE of Calexico, CA |
| 30373759 | 4.0 | 4/4/2010 17:28:36 | 32 8.2 N | 114 59.6 W | 2.2 | 71 km (44 mi) SSW of Yuma, AZ |
| 14608492 | 4.0 | 4/4/2010 17:44:21 | 32 17.7 N | 115 25 W | 5.6 | 42 km (26 mi) S of Calexico, CA |
| 14610748 | 4.0 | 4/4/2010 22:41:37 | 32 37.1 N | 115 46.6 W | 0.5 | 24 km (15 mi) ESE of Ocotillo, CA |
| 14612172 | 4.0 | 4/5/2010 3:05:36 | 32 38.1 N | 115 48 W | 14.1 | 21 km (13 mi) ESE of Ocotillo, CA |
| 14612188 | 4.0 | 4/5/2010 3:09:24 | 32 12.4 N | 115 13.3 W | 10 | 57 km (36 mi) SSE of Calexico, CA |
| 14613348 | 4.0 | 4/5/2010 7:07:05 | 32 13.9 N | 115 22.6 W | 10 | 50 km (31 mi) SSE of Calexico, CA |
| 14613876 | 4.0 | 4/5/2010 9:16:33 | 31 54.6 N | 114 54.9 W | 10 | 92 km (57 mi) SSW of Yuma, AZ |
| 30605759 | 4.0 | 4/5/2010 18:04:35 | 32 36.7 N | 115 47.1 W | 4.9 | 24 km (15 mi) SE of Ocotillo, C A |
| 14616476 | 4.0 | 4/5/2010 18:57:00 | 32 9 N | 115 18.2 W | 10 | 60 km (37 mi) SSE of Calexico, CA |
| 14616628 | 4.0 | 4/5/2010 19:33:34 | 32 15.7 N | 115 33.1 W | 10 | 46 km (28 mi) S of Calexico, CA |
| 14620652 | 4.0 | 4/6/2010 10:19:34 | 32 5.5 N | 115 17.8 W | 22 | 67 km (42 mi) SSE of Calexico, CA |
| 14621516 | 4.0 | 4/6/2010 13:14:25 | 31 48.2 N | 114 58.5 W | 9 | 105 km (65 mi) SSW of Yuma, AZ |
| 14622460 | 4.0 | 4/6/2010 16:41:19 | 32 17.4 N | 115 24.7 W | 10 | 43 km (27 mi) S of Calexico, CA |
| 10591309 | 4.0 | 4/8/2010 19:55:48 | 32 3 N | 115 8.7 W | 26.4 | 76 km (47 mi) SSE of Calexico, CA |
| 10607677 | 4.0 | 4/13/2010 8:36:32 | 32 40.2 N | 115 47.9 W | 3.3 | 20 km (12 mi) ESE of Ocotillo, CA |
| 10615725 | 4.0 | 4/16/2010 8:44:29 | 32 15.4 N | 115 20.1 W | 10 | 48 km (30 mi) SSE of Calexico, CA |
| 14681116 | 4.0 | 4/26/2010 17:09:46 | 32 12.9 N | 115 21.2 W | 20.1 | 52 km (32 mi) SSE of Calexico, CA |
Number of foreshocks and aftershocks (including mainshock), restricted to aftershock zone only:
- M3-M4 = 694
- M4-M5 = 84
- M5-M6 = 6
- M6-M7 = 0
- M7.2=1
Update – Friday, April 16th, 2010 9:52AM
The organizations involved with researching this earthquake have agreed the official name is the El Mayor – Cucapah Earthquake. The name change resulted from field crews mapping the fault ruptures, along with the post processing of the data that showed a trend along the face of the Sierra Cucapah Mountains, north of the Sierra El Mayor mountain range, near where the mainshock was originally located.
There have been more than 3,000 aftershocks related to the M7.2 El Mayor-Cucapah earthquake. As of 2:00PM April 12, 2010, there have been 758 events at least M3.0 or larger. The number of foreshocks and aftershocks per magnitude are shown below. Only a small portion of the events have been analyzed completely by a seismologist. Nearly all M3.0+ aftershocks have been analyzed and are finalized. SCSN has analyzed all M4.0+ events, and are finalized. The backlog of events contain several smaller aftershocks that will be added as post-processing continues. These events may have occurred within the coda of larger events, during robust aftershock activity, or may have poor locations/high residuals. Usually, events which have poor locations or high residuals will be restricted from appearing on earthquake maps, catalog searches, and ShakeMap/CIIM generation, until analyzed by a seismologist.
Number of foreshocks and aftershocks (including mainshock), restricted to aftershock zone only:
- <M2 = 2000+ (estimated)
- M2-M3 = 3000+ (estimated)
- M3-M4 = 683
- M4-M5 = 75
- M5-M6 = 6
- M6-M7 = 0
- M7.2=1
Update – Wednesday, April 14th, 2010 10:12AM
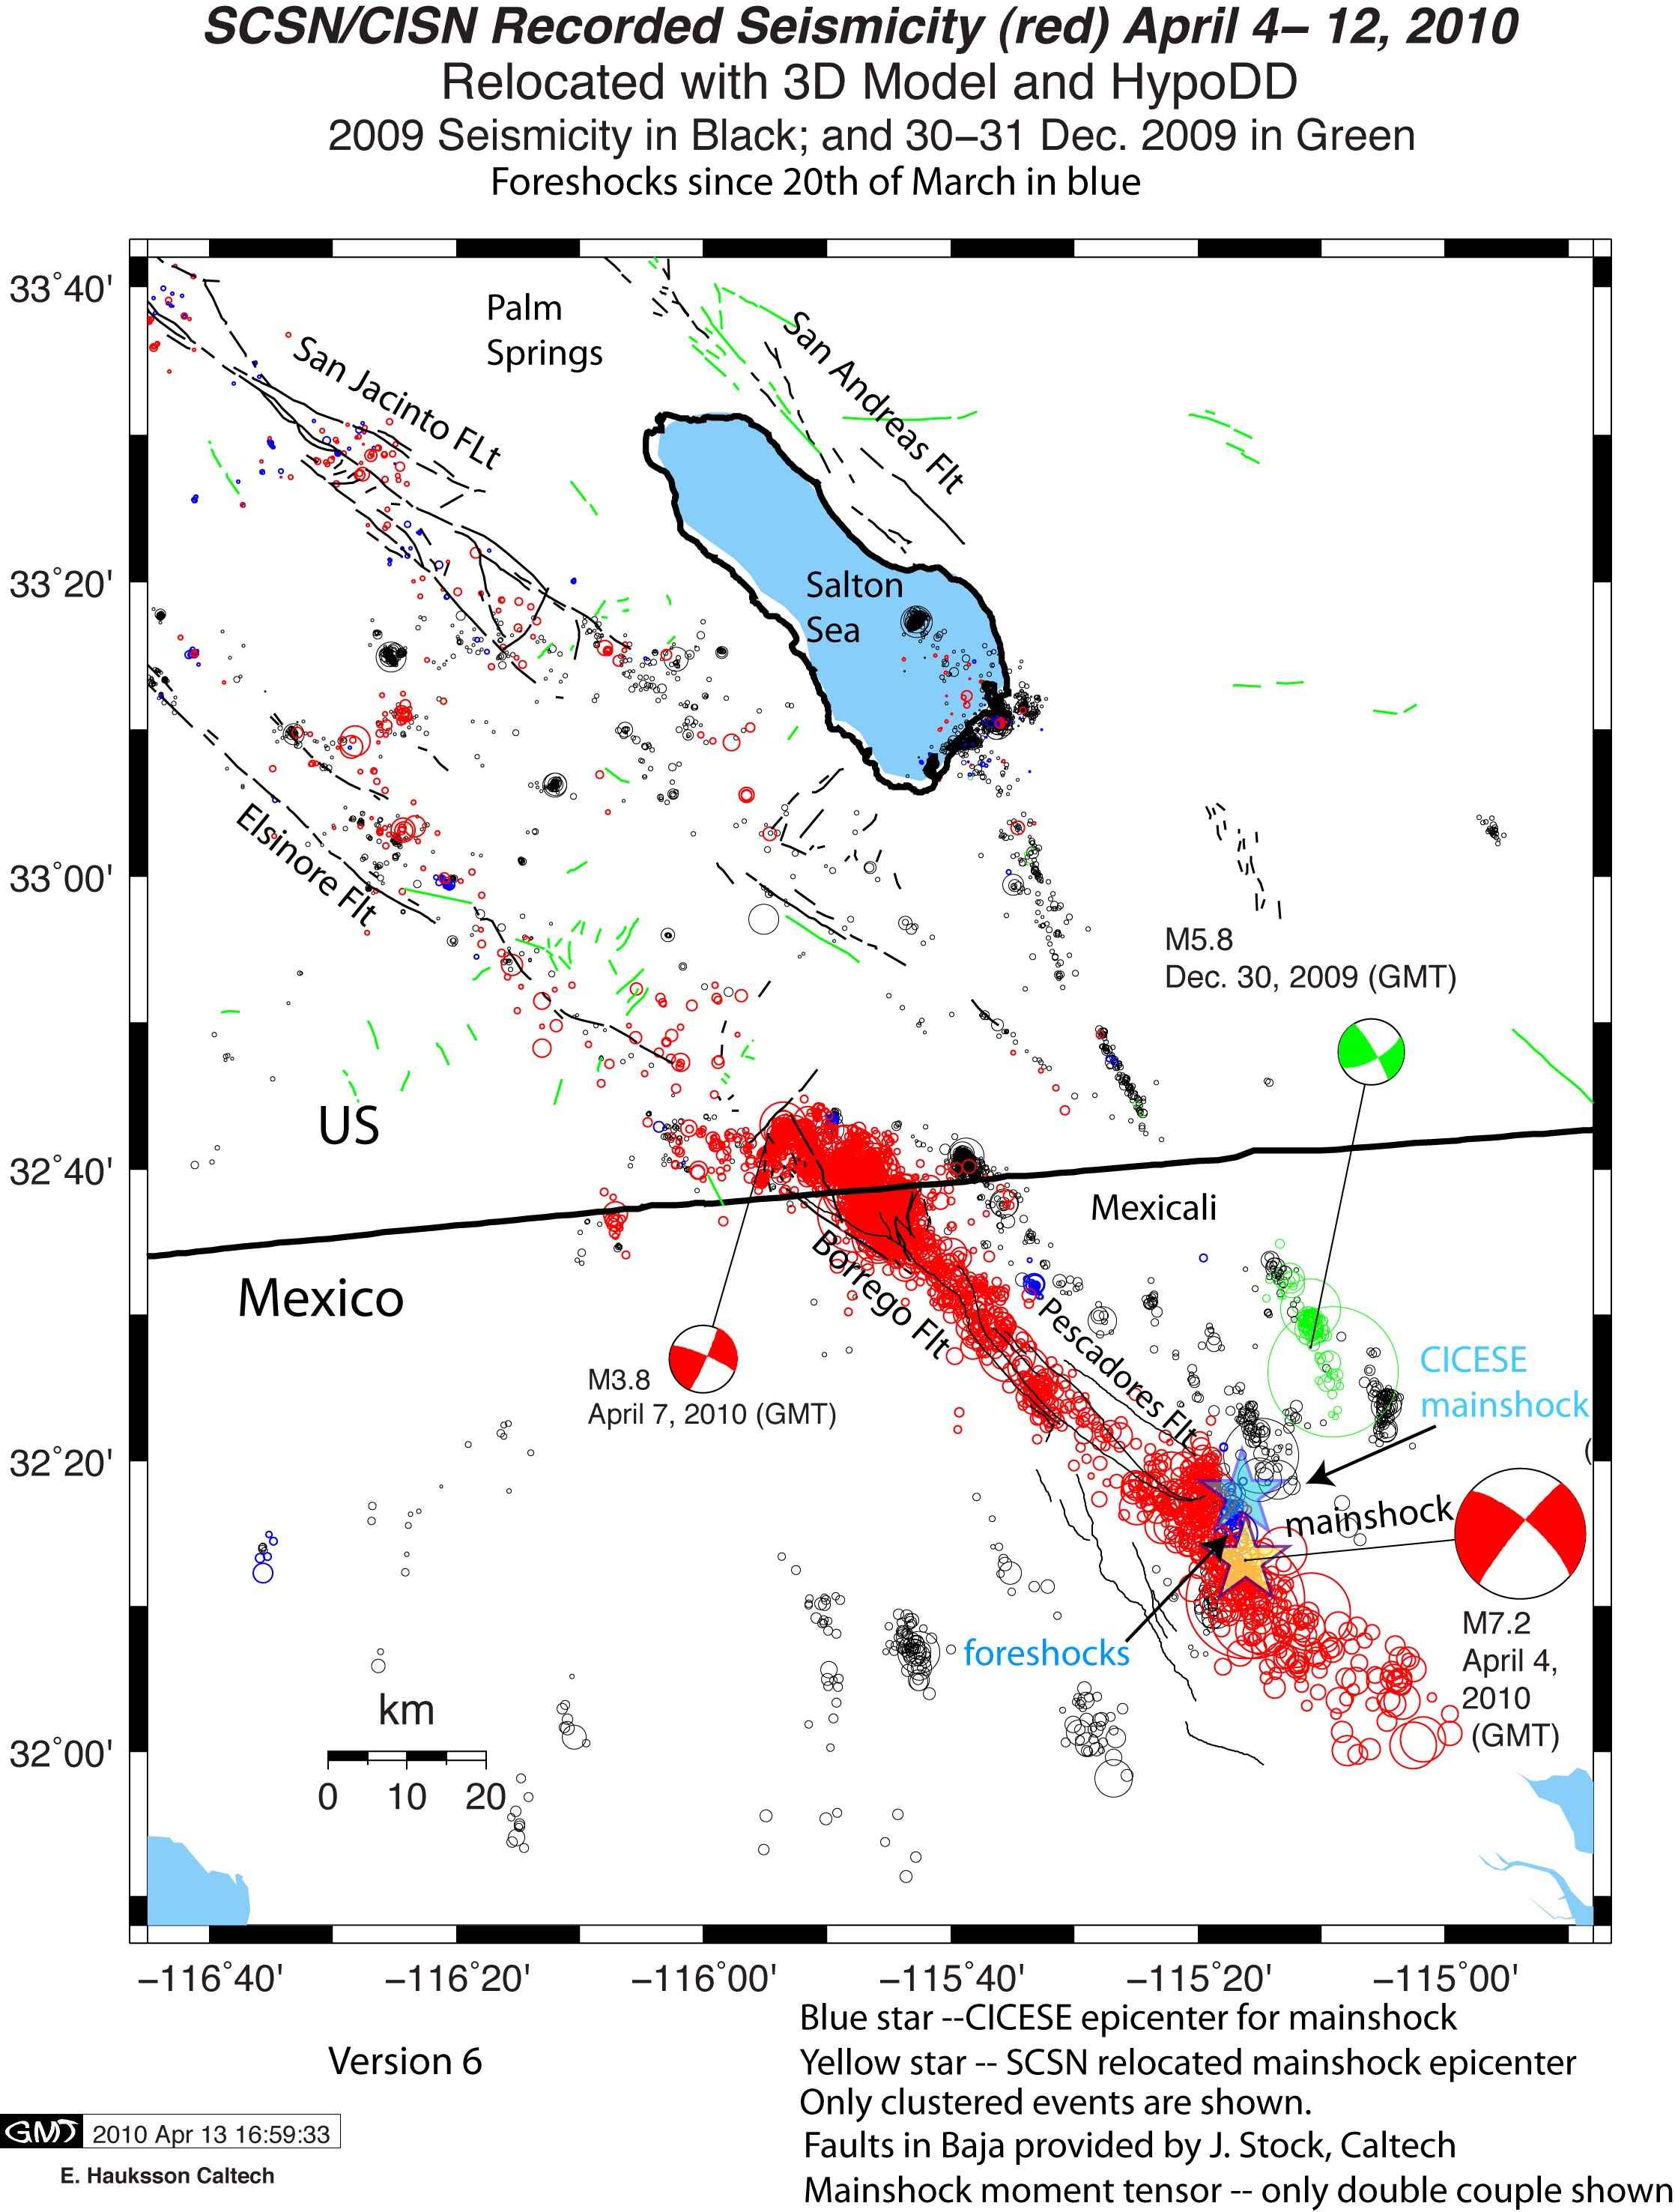
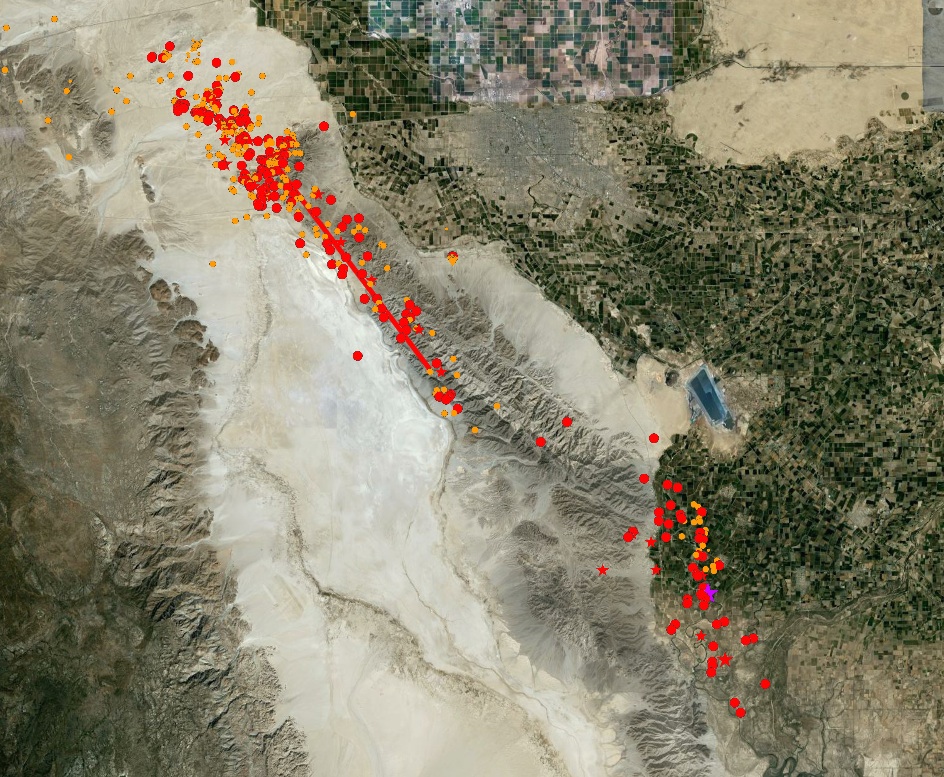
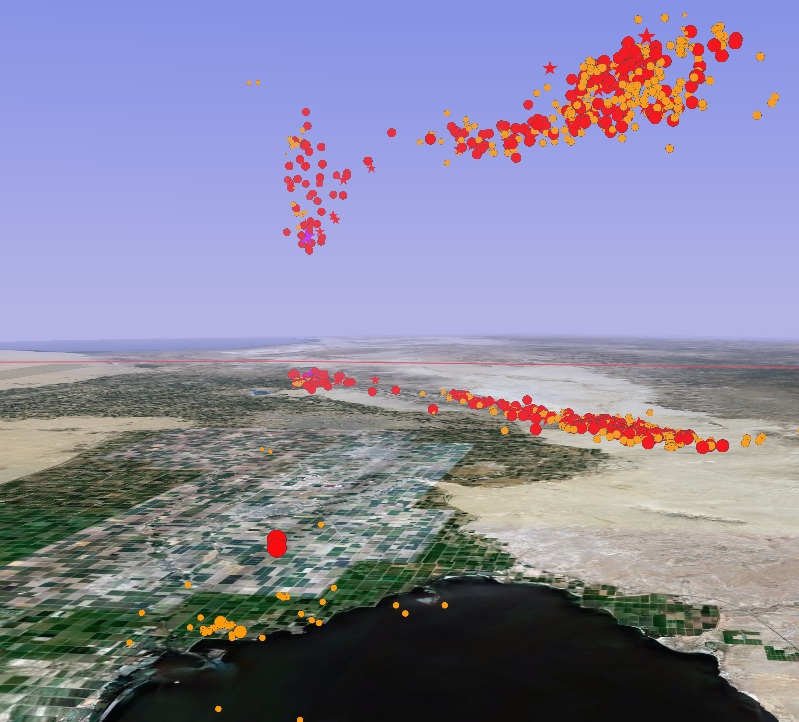
To date, there have been well more than 4,000 earthquakes associated with the Sierra El Mayor earthquake. Post-processing analysis will likely reveal many more smaller events (<M3.0) that were not triggered, or that may be within triggers of larger events. The relocations for foreshocks, aftershocks, and the mainshock are shown below.
Update – Monday, April 12th, 2010 2:03PM
There have been more than 3,000 aftershocks related to the M7.2 Sierra El Mayor earthquake. As of 2:00PM April 12, 2010, there have been 696 events at least M3.0 or larger. The number of aftershocks per magnitude are shown below.
Number of Aftershocks, restricted to aftershock zone only:
- <M2 = 1000+
- M2-M3 = 1882
- M3-M4 = 622
- M4-M5 = 65
- M5-M6 = 8
- M6-M7 = 0
- M7.2=1
Update – Friday, April 9th, 2010 2:23PM
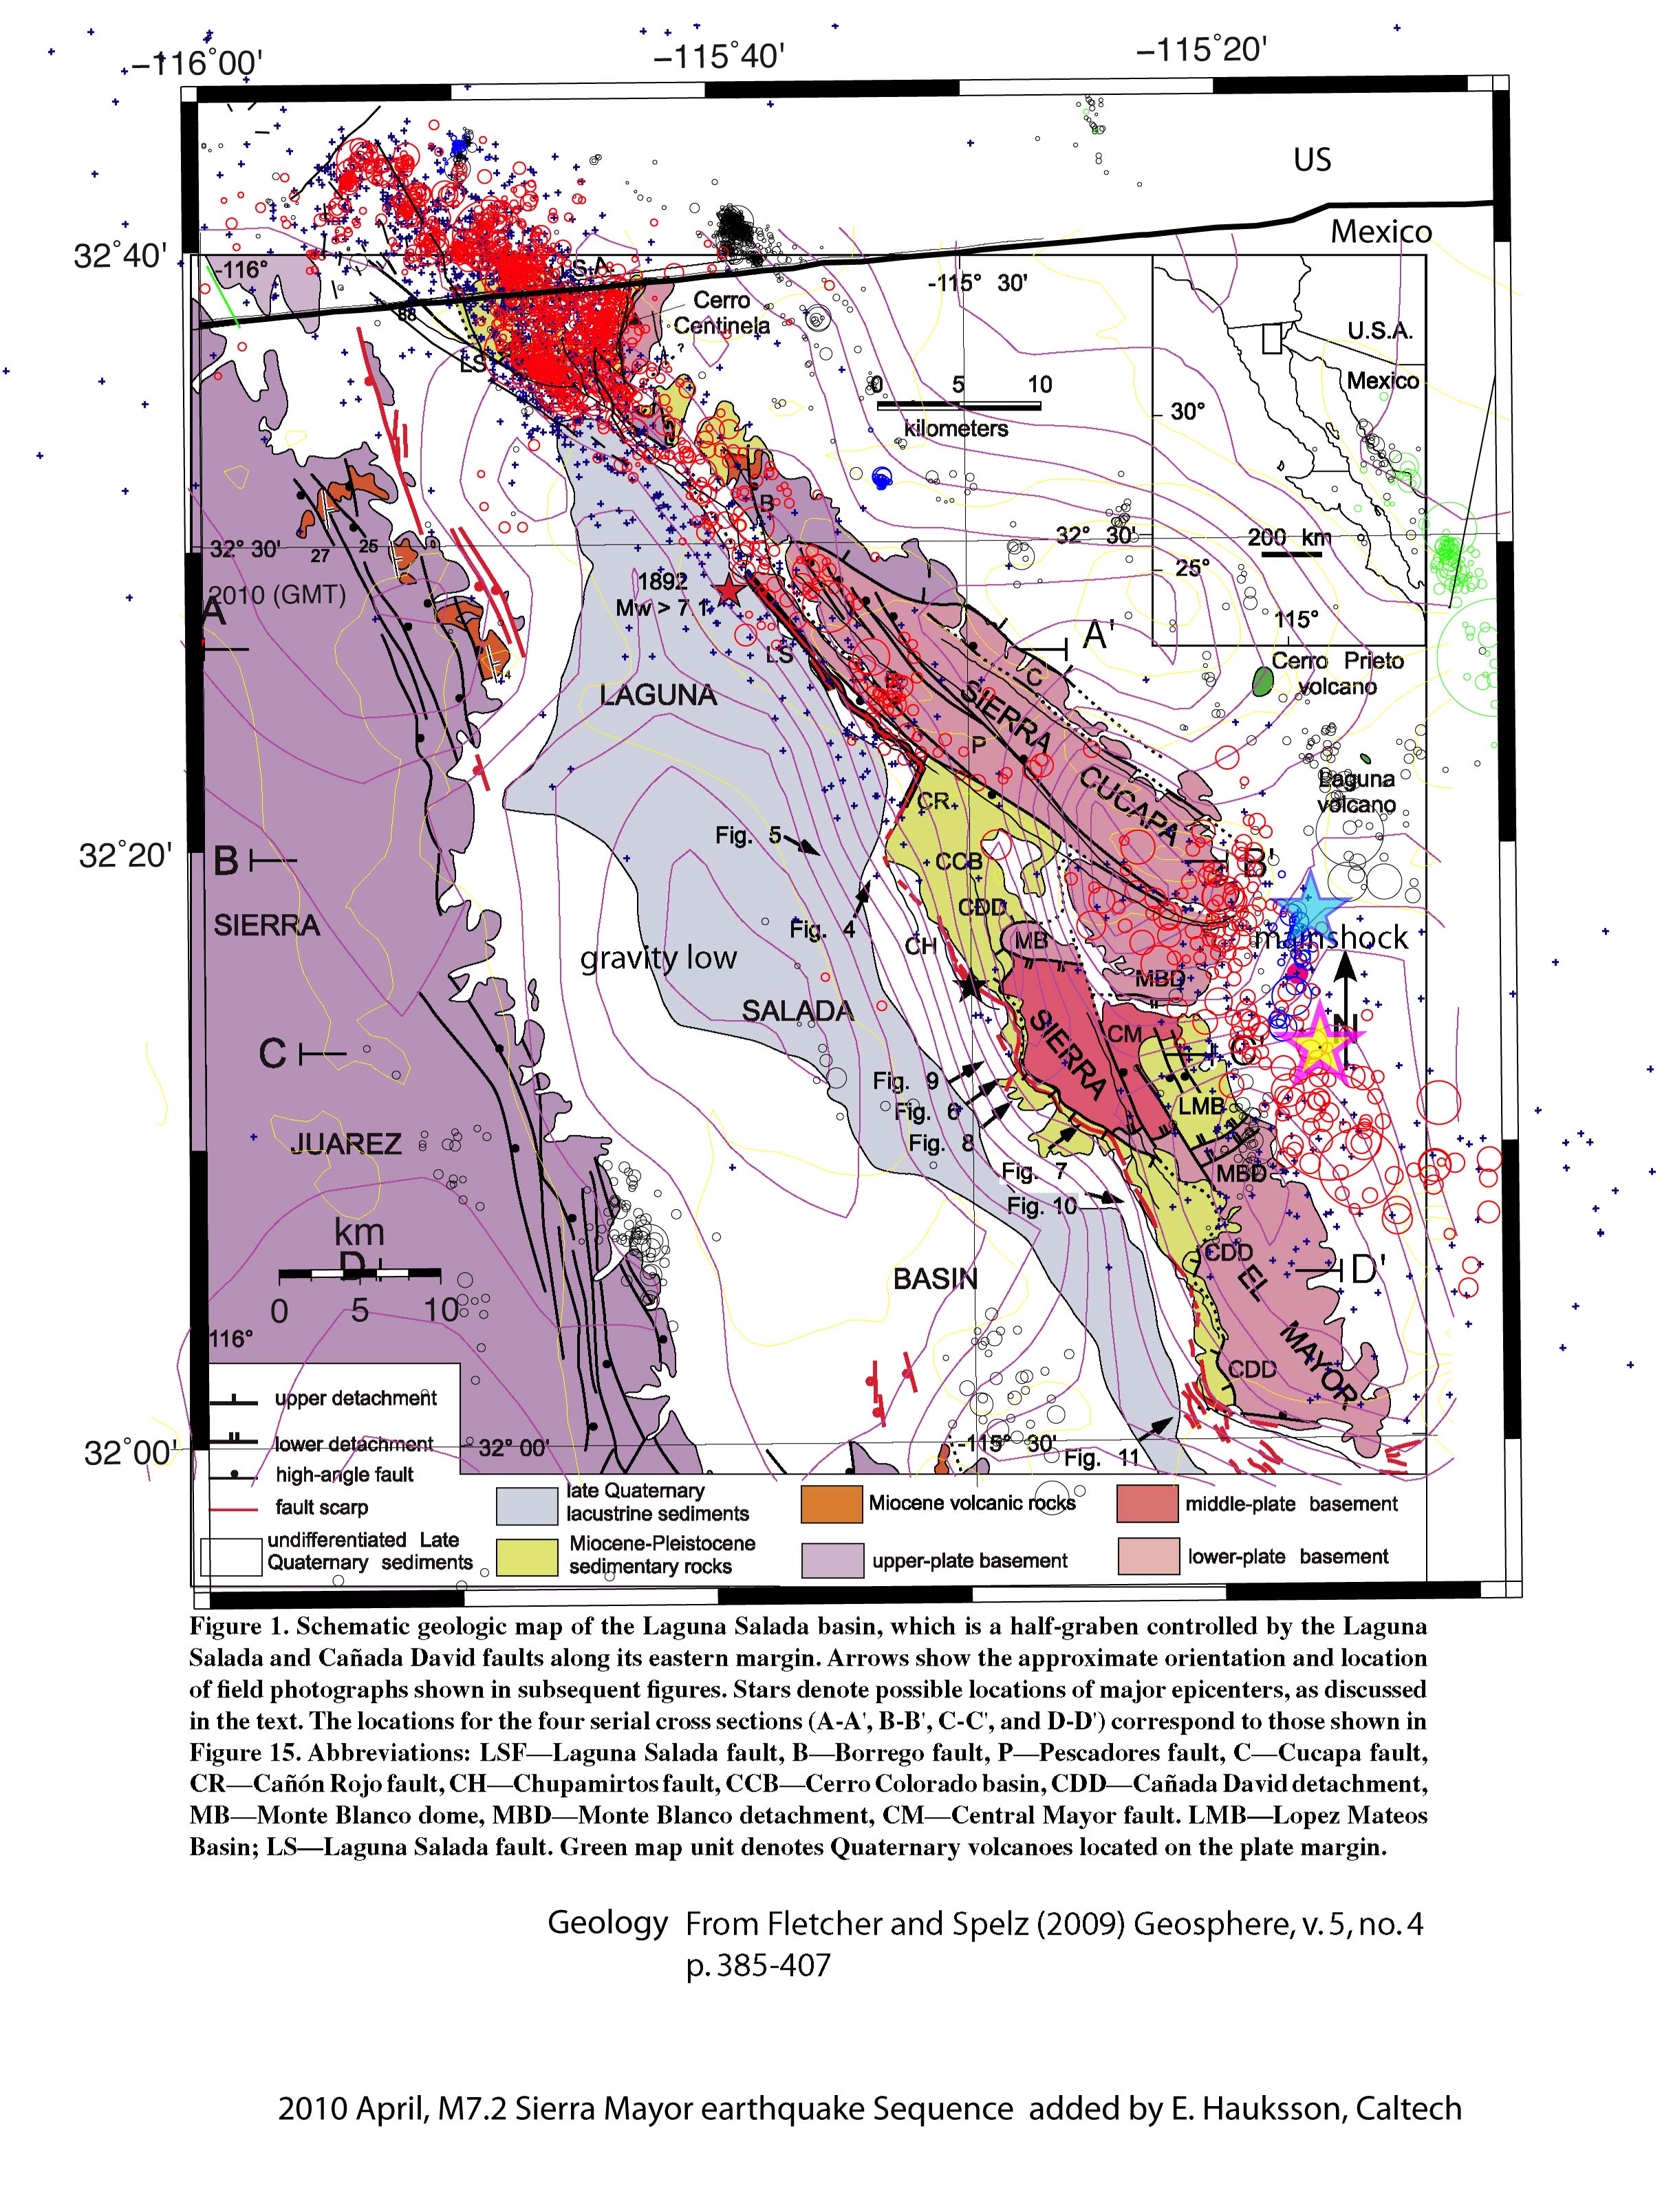
There have been more than 2,000 aftershocks related to the M7.2 Sierra El Mayor earthquake. The map below shows the geology of the region, with the sequence also shown.
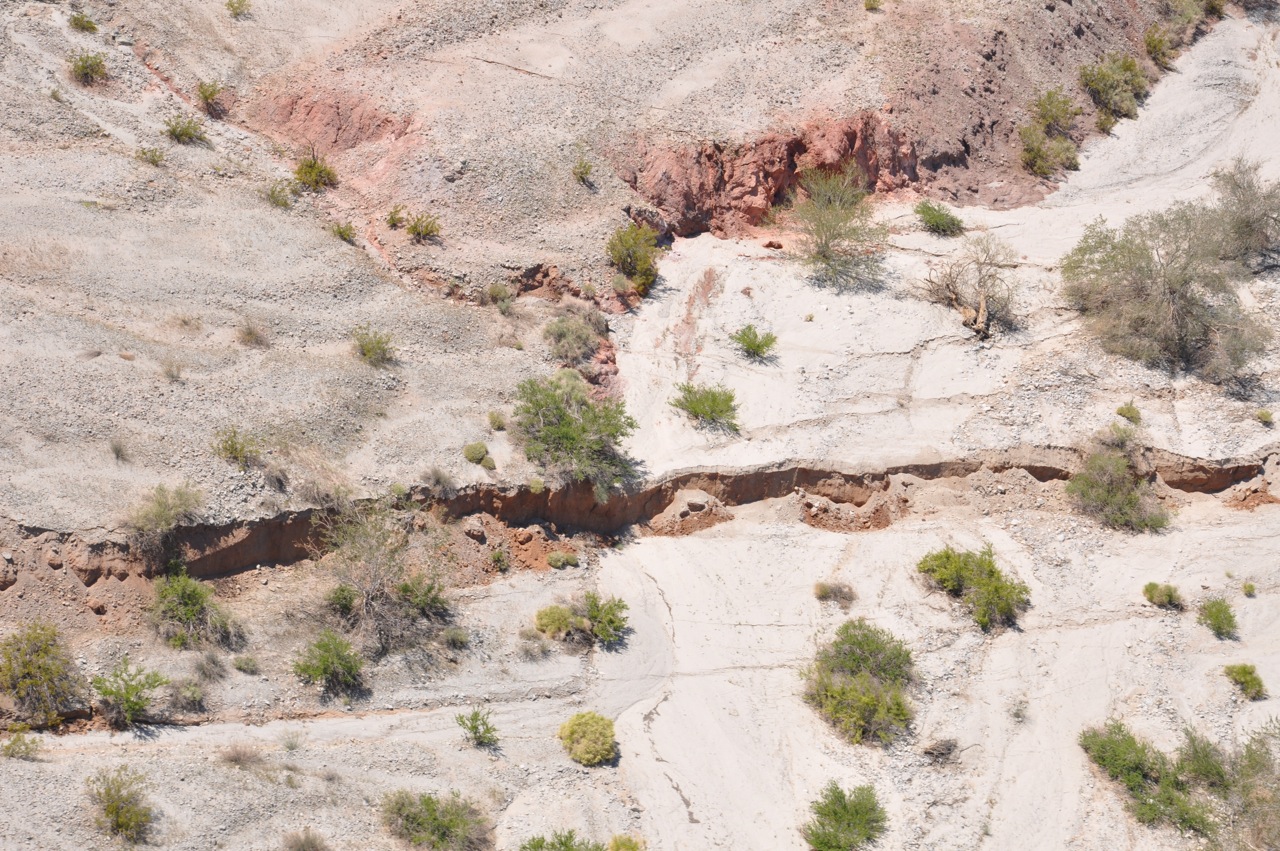
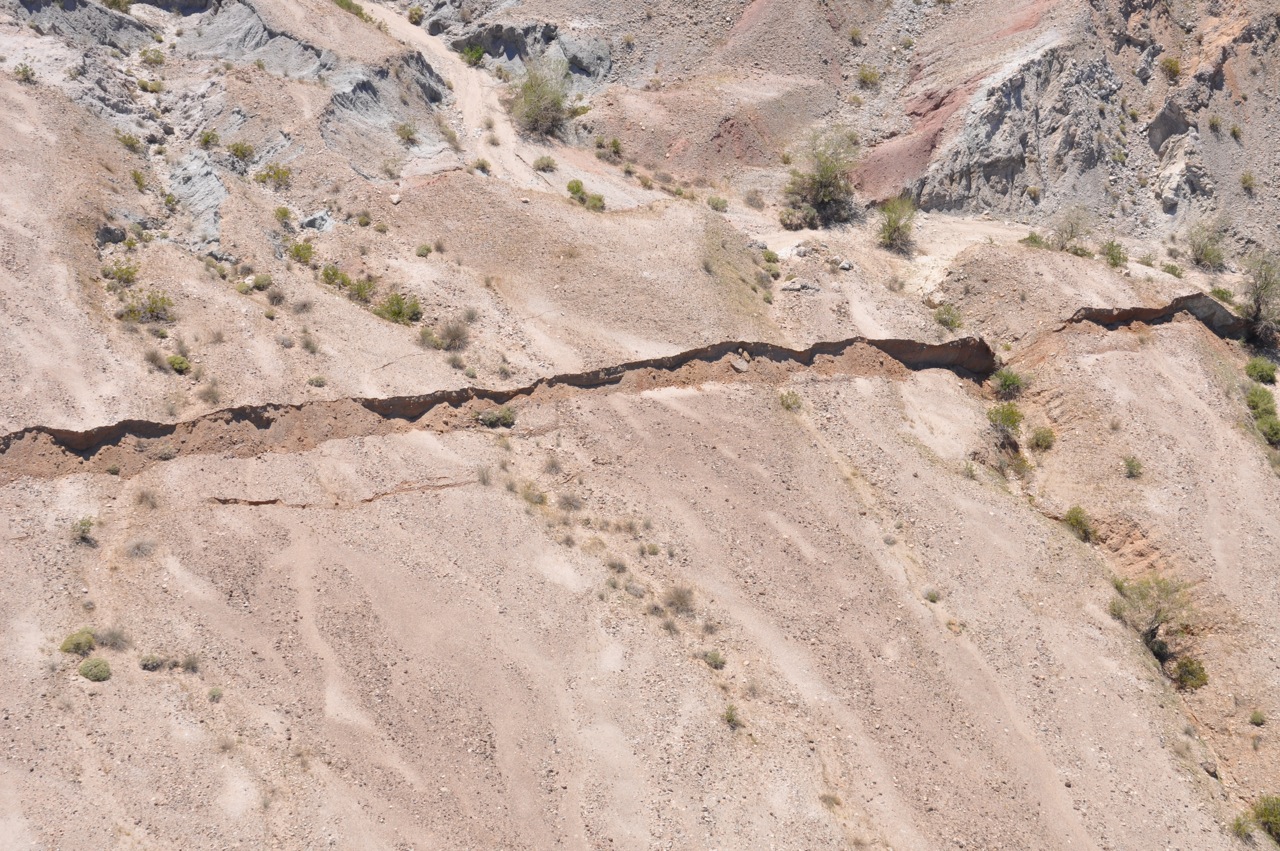
Field photo displaying vertical displacement exeeding 2 meters. More photos are available by clicking on the photo above.Photo by Borrego Rupture Mapping Team (John Fletcher, Prof. CICESE, Orlando Teran, Ph.D. Student, CICISE, Ronald Spelz, Ph.D. Post-doc, UABC, Tom Rockwell, Prof. SDSU, Eulalia Marsana, Prof. Univ. of Barcelona, Geoff Faneros, SDSU).
Update – Thursday, April 8th, 2010 2:13PM
There have been more than 1,500 aftershocks related to the M7.2 Sierra El Mayor earthquake. The map below shows the Hauksson-Shearer relocations. The aftershock list below shows the number of aftershocks by magnitude:
Number of Aftershocks, latitude bounds from 31.90 N to 34.16 N:
- <M2 = 535
- M2 = 1274
- M3 = 492
- M4 = 45
- M5 = 8

Update – Wednesday, April 7th, 2010 10:30AM
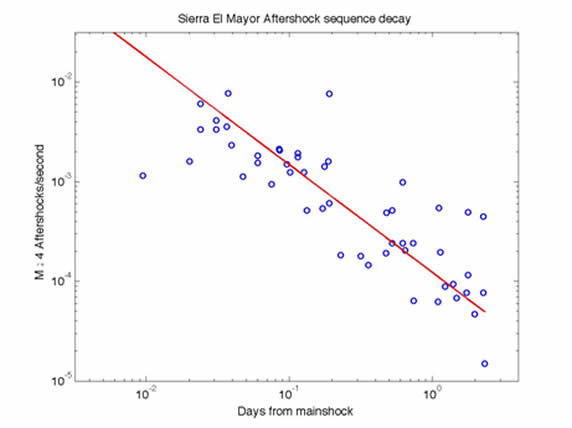
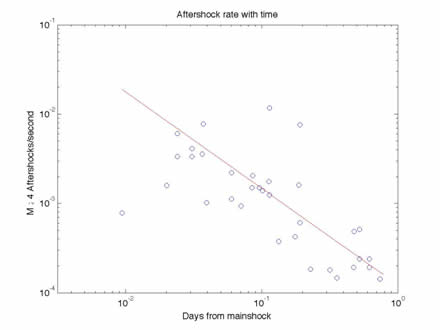
There have been nearly 1,000 events associated with the M7.2 Sierra El Mayor mainshock. Caltech and the USGS are analyzing the real-time data as the data are made available via the real-time computer system, but human analysis is required to provide better locations for smaller events less than M4.0. Aftershocks with magnitude greater than or equal to M4.0 in the SCSN catalog are continuing to show an activity and decay rate very close to the average (mean) California aftershock sequence. Based on this we expect ~3 aftershocks larger than or equal to M4.0 over the next 24 hours, with a 27% chance of one or more M5.0 or larger event. Over the next 7 days we expect ~12 aftershocks to be equal to or larger than M4.0, and have a 70% chance of one or more M5.0 or larger event. Over the next week, the probability that there will be an event larger than the mainshock is 0.7%. The probability that a larger event will occur sometime over the next month is 1.4%. The figure below shows the current aftershock decay fit with the California average.
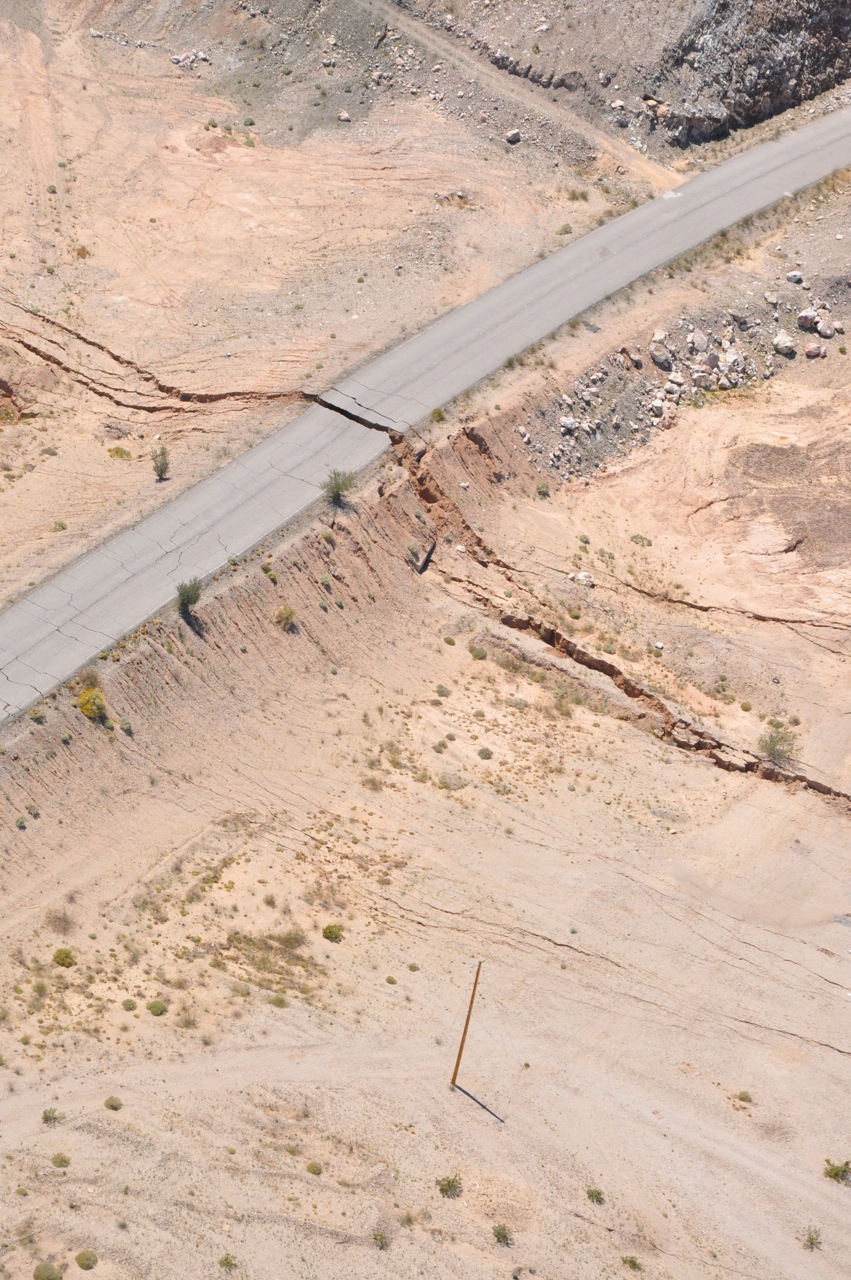
Field Report Update – Wenesday, April 6th, 2010 10:30AM
John Fletcher, Prof. CICESE, Tom Rockwell Prof. SDSU, Javier Gonzalez-Garcia, Scientist, CICESE, Ken Hudnut, Scientist, USGS Anthony Guarino, Seismic Analyst, Caltech Seismological Lab
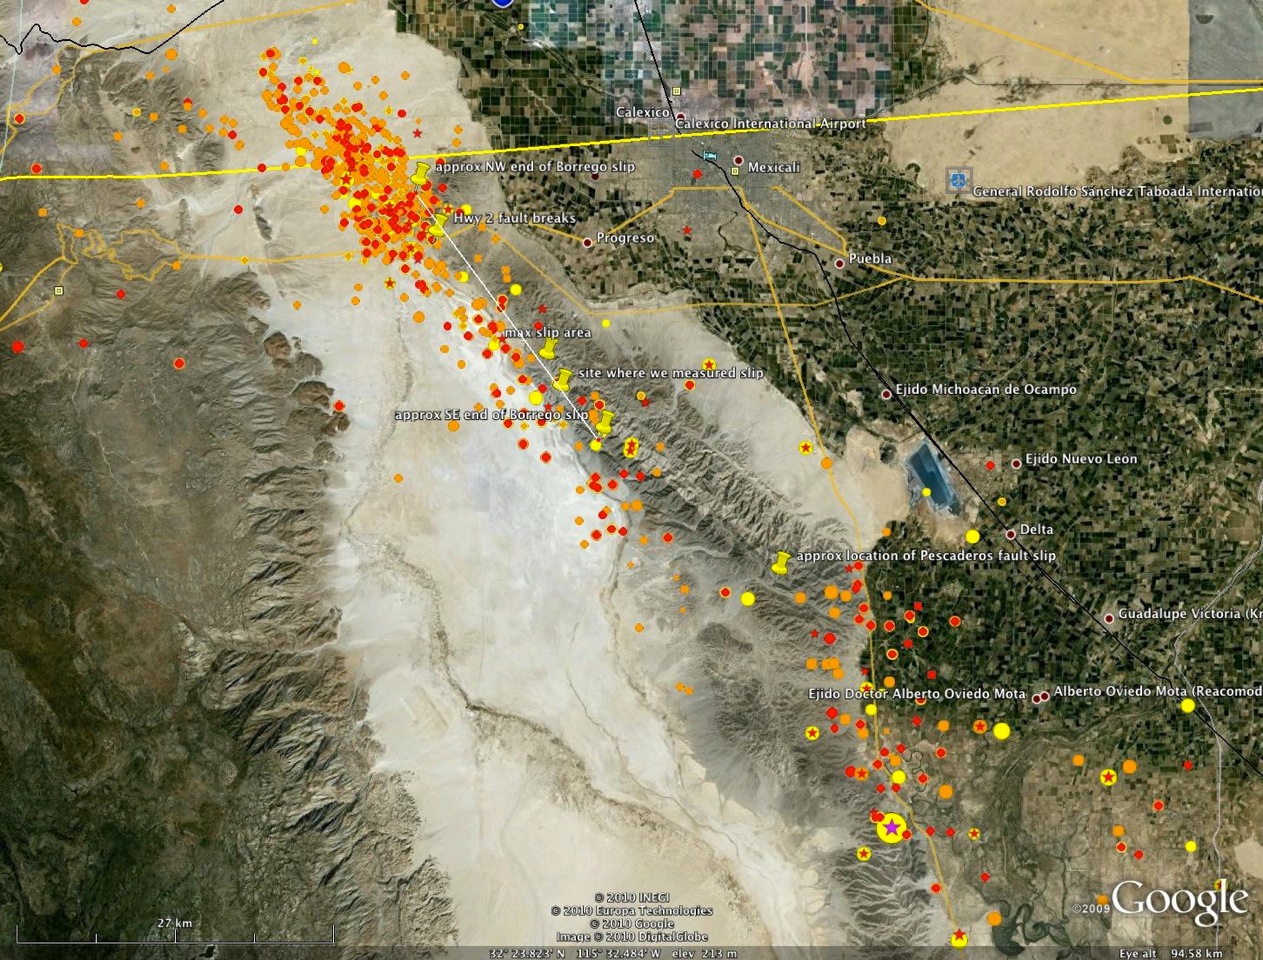
The magnitude 7.2 Sierra El Mayor earthquake caused extensive surface rupture on a 28 km portion of the Borrego fault in northern Baja California Norte, Mexico. The approximate endpoints of the rupture are as follows; the southeast end is located at 32° 25.6’N; -115° 34.3’W. The rupture continues on a N36°W orientation to the northwest end, located at 32°37.1’N; -115°44.6’W. At the northwest end of the fault rupture on the Borrego fault, many splay faults wrap northward along the west side of El Centinela mountain.
The approximate location of maximum slip is 32° 29.1’N; -115° 37.5’W, but was only observed from air, because this area will be easily reached by ground vehicles on Wed. April 7. At the maximum slip area, the group consensus based on observations from the air is that the total slip vector length is 2.5m +-0.75 m of oblique slip, with dominantly east-down motion, but also with a significant component of right-lateral motion.
To the southeast of the maximum slip section, and in an area that will be difficult to reach by vehicle, we landed and measured displacements at 32°27.7′ -115° 36.6′ as follows along a zone oriented N 36° W (see several photos below):
- East-down: 1.10 +/- 0.1 meters
- Right-lateral: 0.78 +/-0.1 meters
- Total length of slip vector: 1.35 +/-0.15 meters
Fracturing along the Laguna Salada fault may be tectonic, at least in places, but the breaks may be due to compaction of the lake sediments lying west of the fault. The documentation of these fractures and discrimination between tectonic and ground failure cause will require extensive follow-up work.
An extensive search for faulting was conducted in the epicentral area of the Sierra El Mayor. Despite thorough searching in the epicentral area on the previously mapped fault traces, only a small amount of slip was observed along a short (few km) section of the Pescadores fault. The Pescadores fault, oriented N40°W, 55°E (Barnard, 1968), did not have nearly as much surface slip overall as the Borrego fault in this event.
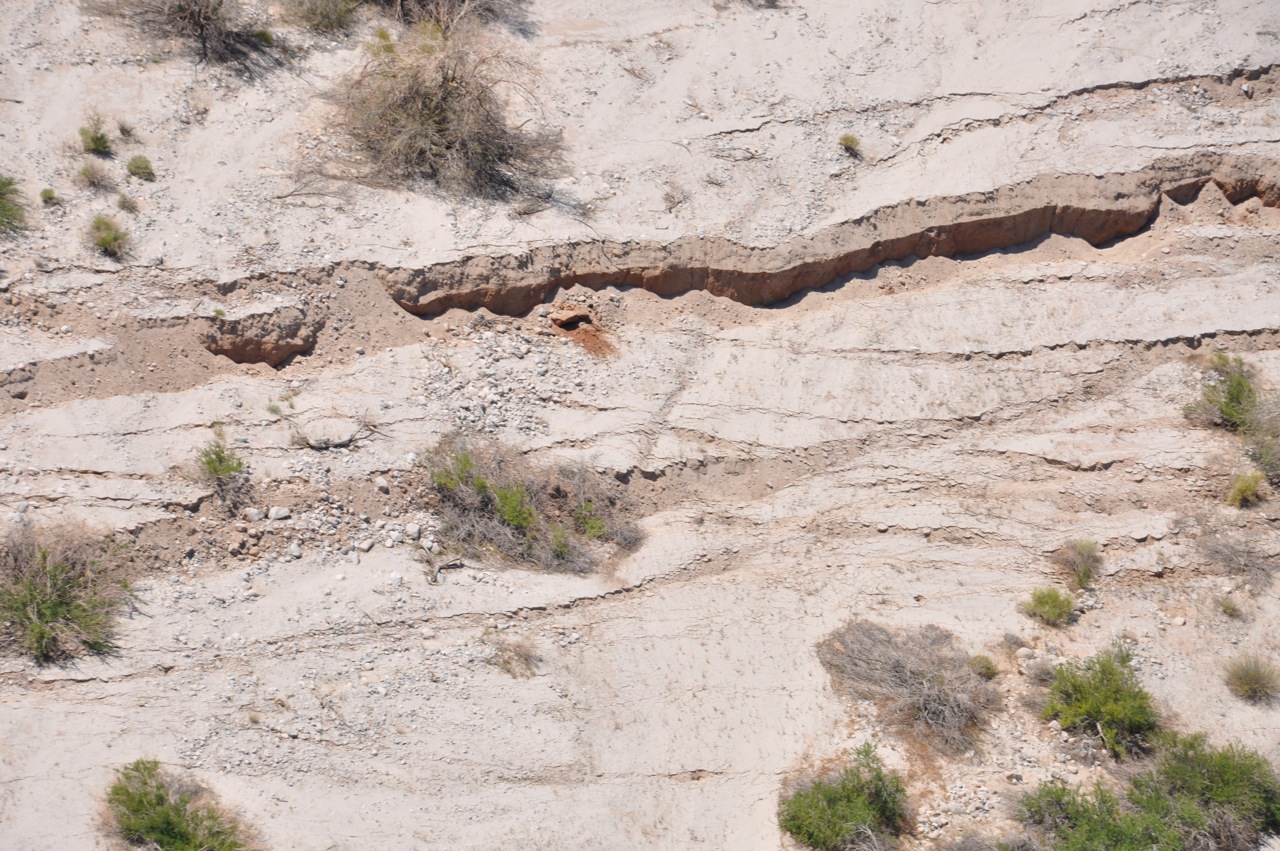
The total slip on the Pescadores fault was relatively minor and localized. There was a small break on the Pescadores fault at 32.313°N ; -115.396°. There was ~20-40 centimeters of slip on the Pescadores fault along this short section (see photo below). This location was observed only during air reconnaissance, and more field work will be required, despite difficult vehicle access to this remote area.
Initial interpretation of today’s observations is that the rupture process likely began on Pescadores fault, which is aligned N40°W from the epicenter. Possibly rupture proceeded from the epicenter for 18 km to the northwest along the Pesdadores fault. Based on seismological source-time function studies, we think there may then have been pause, possibly 6-12 secs, and then triggering of a much larger rupture along the Borrego fault after rupture had slowed and then skipped over to the Borrego fault.
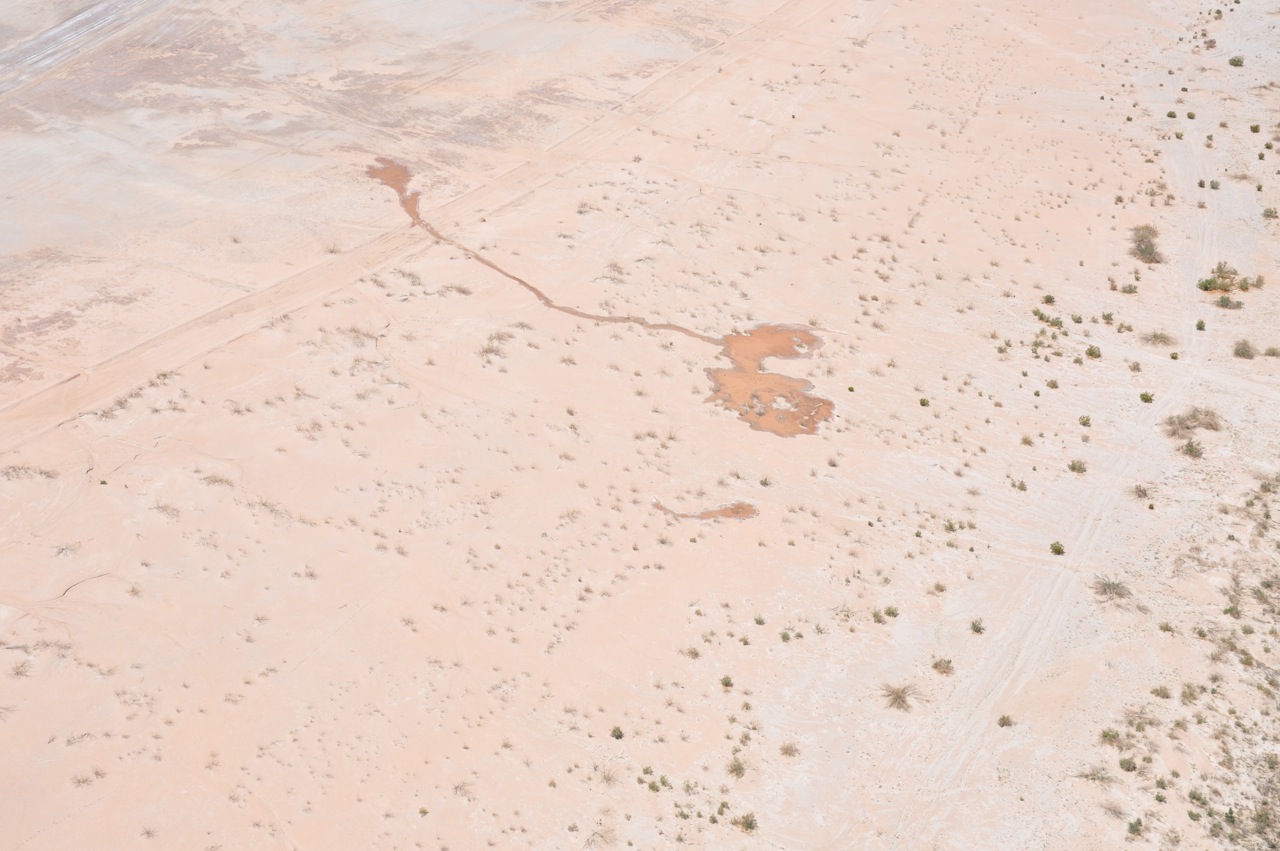
Extensive liquefaction-related features were observed along canal levees, which also experienced widespread shattering along the levee crests. Other phenomena were also observed or reported, such as minor flooding, ground failure/cracking (not related to tectonic faulting), and sand blows.
Well over 1500 air photos were taken, containing embedded GPS coordinates; these will be made available to the public. Thanks to Jim McCrory, helicopter pilot and to USGS for funding the flight.

Update – Tuesday, April 6th, 2010 9:30AM
The magnitude 7.2 Sierra El Mayor earthquake of Sunday April 4th 2010, occurred in northern Baja California, approximately 30 miles south of the Mexico-USA border at shallow depth along the principal plate boundary between the North American and Pacific plates. This is an area with a high level of historical seismicity, and also it has recently been seismically active, though this is the largest event to strike in this area since 1892. The 4 April earthquake appears to have been larger than the M 6.9 earthquake in 1940 or any of the early 20th century events (e.g., 1915 and 1934) in this region of northern Baja California. At the latitude of the earthquake, the Pacific plate moves northwest with respect to the North America plate at about 1.8 inches per year.
The principal plate boundary in northern Baja California consists of a series of northwest-trending strike-slip (transform) faults that are separated by pull-apart basins. The faults are distinct from, but parallel to, strands of the San Andreas fault system. The April 4 main-shock occurred along a strike-slip segment of the plate boundary that coincides with the southeastern part of the Laguna Salada fault system. It is a complex event that may have begun with east-down motion along faults on the eastern edge of the Sierra El Mayor, then progressed to the northwest with oblique slip, that is, a combination of lateral shift to the right and also east-down motion. Overall, the location and focal-mechanism of the earthquake are consistent with the shock having occurred on this fault system. We have received initial measurements from field geologists from the Centro de Investigación Científica y de Educación Superior de Ensenada, BC. (CICESE) who have observed surface rupture associated with the 2010 event at 32.578621° ; -115.725814°. Highway 2 was offset at this location by a total of about 1.2 meters across a zone of fractures that offset the road towards the right, and with the east side also dropping downwards. Aftershocks appear to extend in both directions along this fault system from the epicenter of the 4 April 2010 event.
The aftershock zone extends from near the northern tip of the Gulf of California to 6 miles northwest of the Mexico-USA border. Earthquakes having magnitudes as high as 7 have been historically recorded from the section of the Pacific/North American plate boundary on which the 4 April 2010 earthquake occurred. The 1892 earthquake occurred along the Laguna Salada fault system, but surface offsets associated with the 1892 event lie farther northwest than the 4 April 2010 mainshock’s epicenter. The 2010 event’s aftershock zone extends to the northwest, overlapping with the portion of the fault system that is thought to have ruptured in 1892. The 1940 Imperial Valley earthquake approached magnitude 7, though it occurred farther to the north and on the Imperial fault. Both the 1892 and 1940 earthquakes were associated with extensive surface faulting.
An event of M 7.0 or 7.1 occurred in this region in 1915, and then a M 7.0 to 7.2 in 1934 broke the Cerro Prieto fault with up to several meters of surface slip. In the vicinity of the 4 April 2010 earthquake, there are several active faults and it has not yet been determined specifically which fault the earthquake occurred on. Within the transition from the ridge-transform boundary in the Gulf of California to the continental transform boundary in the Salton Trough, faulting is complex. Most of the major active faults are northwest-southeast oriented right-lateral strike-slip faults that are common in mechanism to the San Andreas fault and parallel Elsinore and San Jacinto faults, that run north of the Mexico-USA border.
Update – Monday, April 5th, 2010 – 5:51PM
A Mw 7.2 earthquake occurred at 3:40PM on Sunday, April 4th, 2010, located near the Laguna Salada fault in northern Baja California in Norte (NTE) B.C., Mexico. This area is a known tectonically active area, and is the principle plate boundary between the North American and Pacific Plates. The fault rupture appears to trend southeast-northwest on the Laguna Salada fault, with the epicenter locate at 32 deg. 7.7 min. N (32.128N), 115 deg. 18.2 min. W (115.303W), although field geologists will need to confirm that this is indeed the case.
There have been reports that ground deformation due to the earthquake has occurred, with displacement observed on Highway 2 at 32°34’43.04"N, 115°43’24.19"W. The offset had 12 breaks total, each measuring between 10-20cm, with a cummulative offset of 1.2 meters, with some east-down, but mostly right-lateral strike-slip.
Preliminary data show the aftershock sequence so far has been robust, and demonstrates a linear feature that trends northwest across a 75-km-long zone, terminating on the USA side of the USA-Mexico border. The aftershock sequence so far has produced several M3+ aftershocks and a few in the M4 and M5 range. The largest aftershock as of 8:00PM on 4/4/10 was a M5.4, preliminarily located at 32.122N 115.061W, 12 miles (19km) SSE of Guadalupe Victoria, B.C. NTE, Mexico.
Prior to this M7.2 event, there were several events to occur very near the area of the epicenter. This sequence began in late March, with several events occurring on March 22 and 23, 2010. There were several foreshocks immediately prior to the event.
For every earthquake in California (and northern Baja), there is approximately a 5% chance that that earthquake will be a foreshock for a larger earthquake, but this percentage quickly declines with time. During the first 24 hours, the chance decreases to 3%, and after 24 hours, it decreases to 1%. Since no larger event has occurred in nearly 24 hours, the likelihood is near 1% at the time of this report (Monday, April 4th, 2010).
Field geologists were dispatched to the location of the event, and should provide more data as time passes, at which time an update to this report may occur (large earthquakes with surface rupture generally take into account the surface rupture to calculate the moment magnitude). With most shallow major earthquakes, liquefaction phenomenon is expected, such as sand volcanoes/sand blows and ground water table fluctuations. Eyewitness reports indicate significant ground water table fluctuations have been observed, but field geologists will need to confirm later today.
This is the largest earthquake to occur in the northern Baja California region since the 1940 M6.9 Imperial Valley earthquake, and the 1892 M7.2 earthquake on the Laguna Salada fault. Another Imperial Valley earthquake occurred in 1979, with a magnitude of M6.4. SCSN has written special reports concerning other earthquakes near Laguna Salada, and has written about the nearby Cerro Prieto geothermal field.

Did You Feel It? (CIIM – Community Internet Intensity Map):
As of 11:30 AM PDT, we have had 74,356 responses for the CIIM (Community Internet Intensity Map), also known as the "Did You Feel It?" map. This map is strictly subjective; it is based on only observational reports from people in the community as they fill out a form with felt information on it.
The largest reported intensity for the CIIM reports were generated closest to the areas near the fault rupture. As fewer reports were made in Mexico, the map is less complete for the international areas. All international CIIM Maps represent felt reports with a colored circle, rather than a polygon zip code.
For the cities in the United States, the maximum reported intensity was Calexico, El Centro, Herber, and Imperial. So far, 146 reports exceeding intensity of VII have been collected, with several more less than VII. Other reports may be delayed due to power loss, lack of internet, or other earthquake-related problems. In this case, the ShakeMap may be used to infer intense shaking, as it is an objective map based primarily on instrumental observation (see ShakeMap above).
The damage extended as far south as Colonia Vincente Guerrero in Baja California NTE, Mexico, and as far north as northern southern Orange County.

The CIIM Map (“Did You Feel It?” Map) above shows nearly 75,000 responses within the first 20 hours after the event. Most of these were reported within the first hour, and nearly 65,000 had responded within the first two hours. Click on the above image to link to the CIIM Map and the "Did You Feel It?" form.
Tectonic Summary
Tectonic Summary A magnitude 7.2 earthquake occurred at 3:40:40 p.m. (local time at the epicenter) on Sunday, 4 April 2010 in Baja California, approximately 75 km south of the Mexico-USA border. The earthquake occurred at shallow depth (approximately 10 km) along the boundary zone between the North American and Pacific plates. Since earthquakes have been recorded instrumentally, only two similar sized earthquakes have been recorded in the area. The first was the 1892 earthquake estimated at magnitude 7.22 along the Laguna Salada fault just south of the USA-Mexico border. The second was the 1940 Imperial Valley magnitude 6.9 earthquake which occurred in southernmost California. Today’s event is located nearly in line with these earthquakes along the plate boundary, but is situated farther to the south. There are several active faults in the vicinity of today’s earthquake, and the particular fault that generated this quake has not yet been determined. Faulting is complex in this region, because the plate boundary is transitional between the ridge-transform system in the Gulf of California and the continental transform system in the Salton Trough. Most of the major active faults are right-lateral strike-slip faults with a northwest-southeast orientation, similar in style to the San Andreas fault to the north. Other faults in the vicinity with the same orientation include the Cerro Prieto fault and the Laguna Salada fault.
Foreshocks, Mainshocks, and Aftershocks
There have been foreshocks indicated for this event, the closest to the mainshock was a M3.9, which occurred at 3:09PM, 31 minutes before the M7.2 mainshock. Prior to that time, there were a number of foreshocks due to the ongoing activity for a sequence in that area. The sequence that occurred prior to the mainshock was not out of the ordinary for the area.
To date, there have been more than 500 aftershocks associated with this event; most have been between M2.0 and M4.0, with a few exceeding M4.0. The list of aftershocks will be disseminated later today, as locations are reviewed by seismologists.
Using California average parameters, we expect 8-9 M≥ 4 aftershocks over the next 24 hours, with a 56% chance of one or more M≥ 5. Over the next 7 days we expect ~22 M≥ 4 and ~2 M≥ 5 aftershocks, and have a ~1% chance of having an event larger than the mainshock. The figure below shows the current aftershock decay fit with the California average.
We will likely expect aftershocks for years with a magnitude 7+ event in Southern California. Generally, with earthquakes in Southern California and northern Baja California, there is a significant likelihood that an aftershock one whole magnitude less will occur within the first week (i.e.in this case a ~M6-M6.2). The likelihood also decays as time passes. For most large earthquakes, a normal aftershock sequence that would follow a logarithmic relationship, where we would expect 10 magnitude 5 range events, 100 magnitude 4 range events, and 1000 magnitude 3 range events. As stated, the more time that passes, larger aftershocks are less likely.
Historical Seismicity
Large historical seismic events in the vicinity (both involved primarily right-lateral strike-slip faulting with significant surface rupture). The area has been very seismically active in the past, with many swarms and sequences near the location of this mainshock and aftershock zone. The following large events have occurred in the area:
- 1979 MW6.4 on the Imperial/Brawley/Rico faults:
- 1940 MW 6.9 on the Imperial fault:
- 1892 M 7.2 on the Laguna Salada fault:
Within a smaller 50 km search radius of the epicenter, this is the largest earthquake since a M6.1 in 1980
| YEAR MO DA | ORIG TIME | LAT | LONG | DEP | MAGNITUDE | DIST (in km) |
|---|---|---|---|---|---|---|
| 1978 05 05 | 210315.80 | 32.22 | -115.32 | 5 | 5.5 MLPAS | 15 |
| 1980 06 09 | 032818.90 | 32.22 | -114.99 | 5 | 6.1 MLPAS | 27 |
| 2001 12 08 | 233610.66 | 32.04 | -114.91 | 10 | 5.8 MwGS | 32 |
| 2002 02 22 | 193241.75 | 32.32 | -115.32 | 7 | 5.7 MwGS | 26 |
| 2009 12 30 | 184857.70 | 32.44 | -115.17 | 9 | 5.9 MwGCMT | 38 |
Pager Population Exposure
More than one million people were exposed to shaking meeting or exceeding VI intensity. This is strong shaking with light damage to resistant structures (reinforced concrete, wood-framed homes, etc), and moderate damage or greater to vulnerable buildings (non-reinforced masonry, brick, cinder-block without reinforcement, etc). Nearly three million people were exposed to moderate shaking, with intensity of V, but little or no damage would be expected to reisistant buildings with intensity nearing V. Some mild to moderate damage may occur for buildings that are built vulnerable.
All together, nearly four million people may have been in the area that could have felt the earthquake with intensity of IV or larger, but felt reports indicate that some people may not have felt shaking in these areas.
PAGER population exposure by intensity. PAGER shows that five thousand people were within VIII intensity, but more than two million people were exposed to shaking intense enough to cause at least mild damage.
Moment Tensor Solution
USGS Moment Tensor Solution – SCSN moment tensor was not included in this report due to station coverage south of the border. The motion demonstrated for the moment tensor is oblique right-lateral strike-slip motion, occurring on a nodal plane striking 321 degrees. The aftershocks are lining up on more than one distinct linear feature, so more data analysis is required. Keep posted to SCSN for updates.
Centroid Moment Tensor 10/04/04 22:40:46.15 BAJA CALIFORNIA, MEXICO
Epicenter: 32.237 -115.083 MW 7.3 USGS CENTROID MOMENT TENSOR
10/04/04 22:41:23.89 Centroid: 33.000 -114.921 Depth 14
No. of sta:133
Moment Tensor; Scale 10**19 Nm, Mrr=-2.77, Mtt=-5.63, Mpp= 8.40, Mrt= 3.15, Mrp=-5.70, Mtp=-1.00
Principal axes: T Val= 11.08 Plg=23 Azm= 81 N -3.02 41 329 P -8.06 39 193 Best Double Couple:Mo=9.6*10**19
NP1:Strike=220 Dip=43 Slip= -13 NP2: 321 80 -131
W Phase Moment tensor 10/04/04 22:40:45 BAJA CALIFORNIA, MEXICO
Epicenter: 32.192 -115.095 MW 7.2 USGS/WPHASE CENTROID MOMENT TENSOR
10/04/04 22:40:45.00 Centroid: 32.192 -115.095 Depth 15
No. of sta: 29
Moment Tensor; Scale 10**18 Nm Mrr=-1.72 Mtt=-4.90 Mpp= 6.61 Mrt= 2.90 Mrp=-1.71
Mtp= 0.14
Principal axes: T Val= 6.96 Plg=11 Azm= 87 N -0.28 55 339 P -6.69 31 185
Best Double Couple:Mo=6.8*10**19
| Plane | Strike | Dip | Slip |
|---|---|---|---|
| NP1: | 222 | 59 | -14 |
| NP2: | 319 | 77 | -147 |
USGS/NEIC Summary Regarding the Mw7.2 Laguna Salada Earthquake3:
The magnitude 7.2 northern Baja California earthquake of Sunday April 4th 2010, occurred approximately 40 miles south of the Mexico-USA border at shallow depth along the principal plate boundary between the North American and Pacific plates. This is an area with a high level of historical seismicity, and also it has recently been seismically active, though this is the largest event to strike in this area since 1892. Today’s earthquake appears to have been larger than the M 6.9 earthquake in 1940 or any of the early 20th century events (e.g., 1915 and 1934) in this region of northern Baja California. At the latitude of the earthquake, the Pacific plate moves northwest with respect to the North America plate at about 45 mm/y. The principal plate boundary in northern Baja California consists of a series of northwest-trending strike-slip (transform) faults that are separated by pull-apart basins. The faults are distinct from, but parallel to, strands of the San Andreas fault system. The April 4 main-shock occurred along a strike-slip segment of the plate boundary that coincides with the southeastern part of the Laguna Salada fault. Although the location and focal-mechanism of the earthquake are consistent with the shock having occurred on this fault, we do not yet have surface rupture or other confirmation. Aftershocks appear to extend in both directions along this fault system from the epicenter of today’s event. The aftershock zone extends from the northern tip of the Gulf of California to the Mexico-USA border. Earthquakes having magnitudes as high as 7 have been historically recorded from the section of the Pacific/North American plate boundary on which the 4 April 2010 earthquake occurred. The 1892 earthquake occurred along the Laguna Salada fault system, but significantly farther northwest than today’s event epicenter. The 1940 Imperial Valley earthquake approached magnitude 7, though it occurred farther to the north and on the Imperial fault. Both the 1892 and 1940 earthquakes were associated with extensive surface faulting. An event of M 7.0 or 7.1 occurred in this region in 1915, and then a M 7.0 to 7.2 in 1934 broke the Cerro Prieto fault with up to several meters of surface slip. In the vicinity of the 4 April 2010 earthquake, there are several active faults and it has not yet been determined specifically which fault the earthquake occurred on. Within the transition from the ridge-transform boundary in the Gulf of California to the continental transform boundary in the Salton Trough, faulting is complex. Most of the major active faults are northwest-southeast oriented right-lateral strike-slip faults that are common in mechanism to the San Andreas fault and parallel Elsinore and San Jacinto faults, that run north of the Mexico-USA border.
- John Fletcher field observations, 04/05/2010, Centro de Investigacion Cientifica y de Educacion Superior de Ensenada, Baja California, Mexico
- Revisiting the 23 February 1892 Laguna Salada Earthquake, Susan Hough and Austin Elliot
- USGS Summary Report on M7.2 http://earthquake.usgs.gov/earthquakes/recenteqsus/Quakes/ci14607652.php#summary