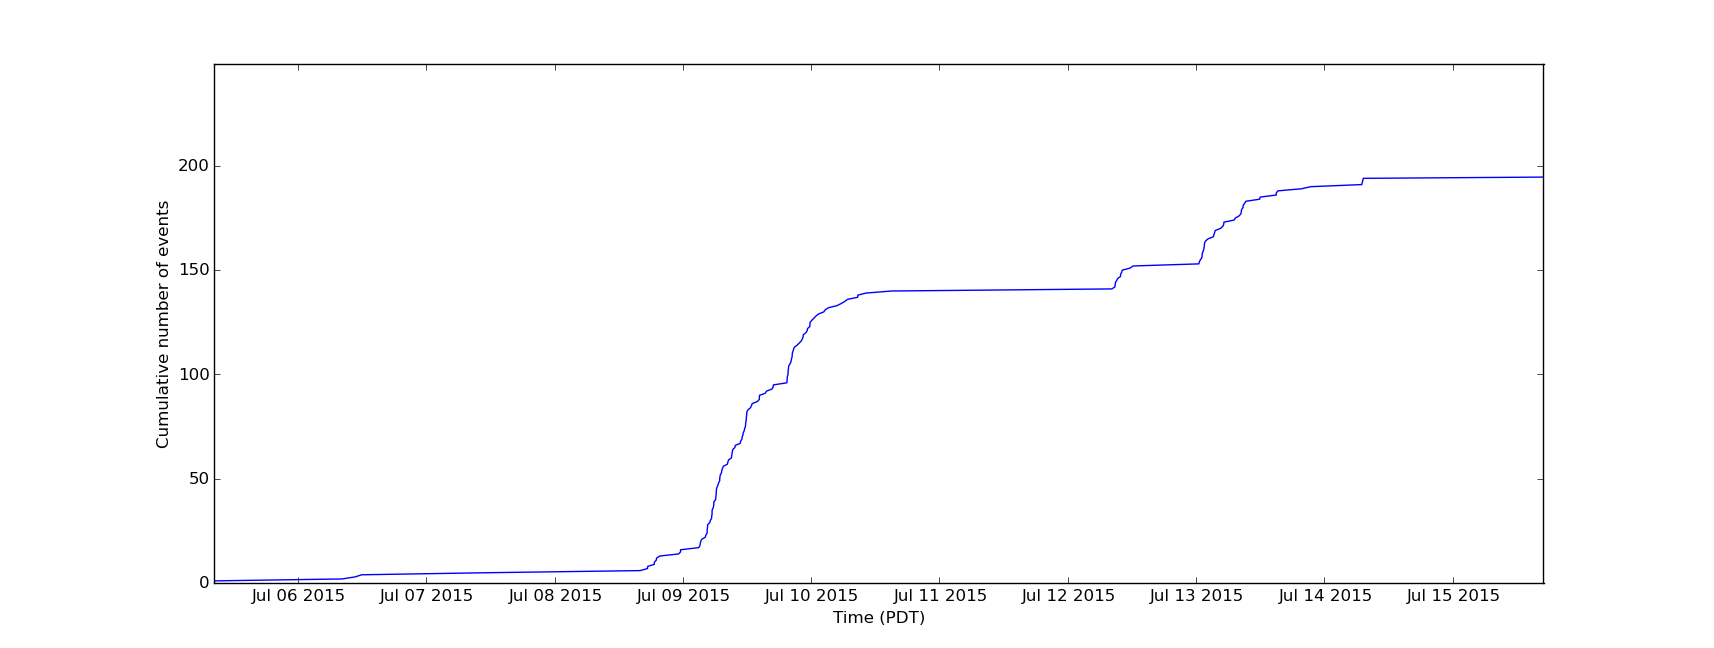
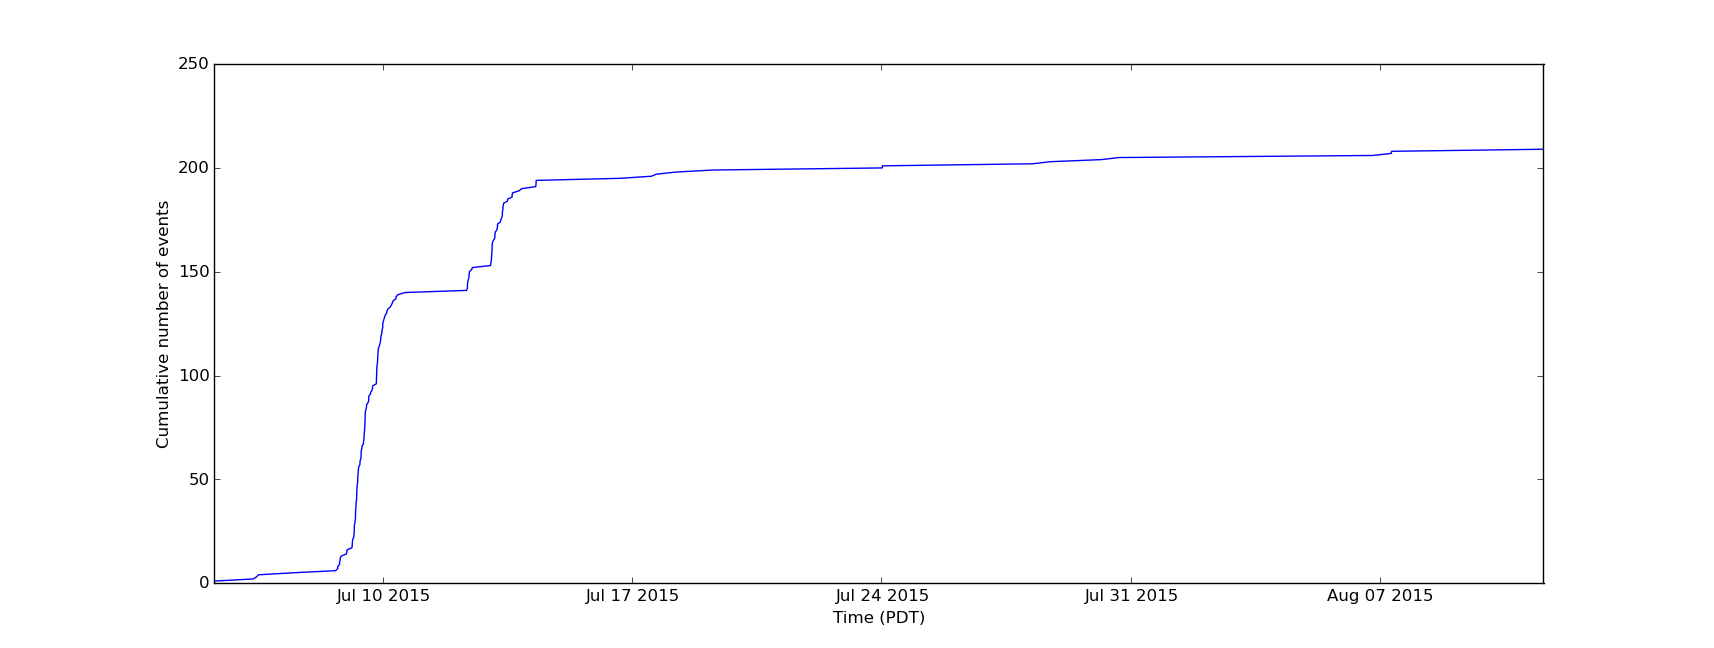
A swarm of earthquakes started at 6 am on 5th of July 2015 in Ventura, southern California.
As of 12 pm on 13 July a total of 181 earthquakes of M1.0 to M2.8 have been recorded by the CISN, 38 of which have been M2.0 or greater. The swarm consists of a number of clusters, the most intense activity occurring on July 9th. Between July 5th and July 8th, 1 – 5 events occurred per day, magnitudes up to M2.3. The rate increased during July 9th, peaking with 10-13 events per hour. Further pulses of activity occurred on July 12th and July 13th with a peak of 9 events between 1 and 2 am on July 13th.
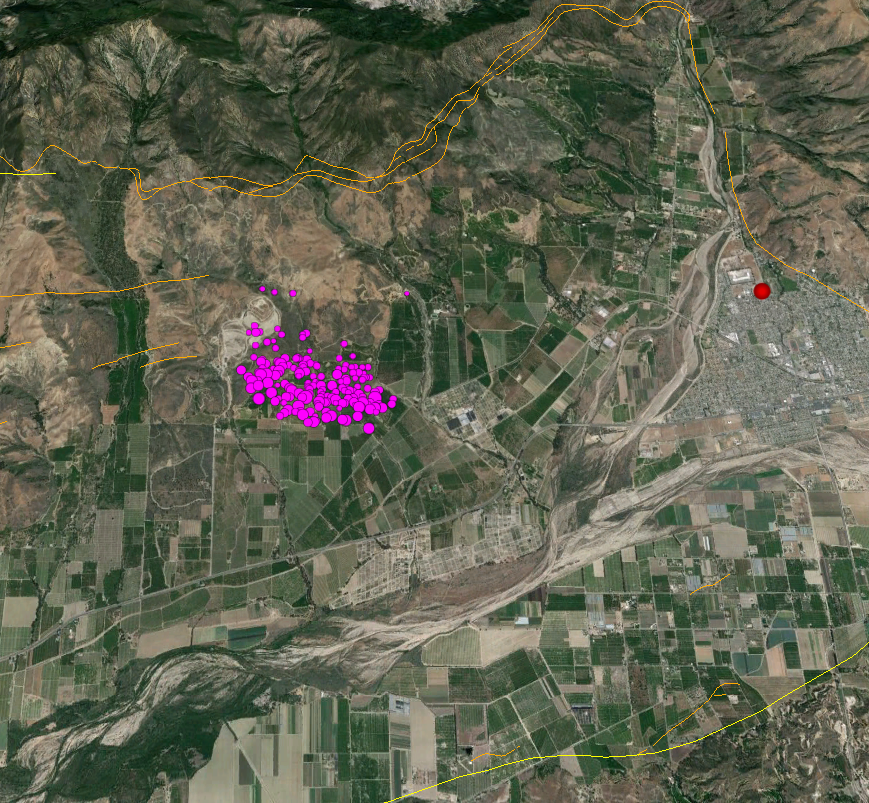
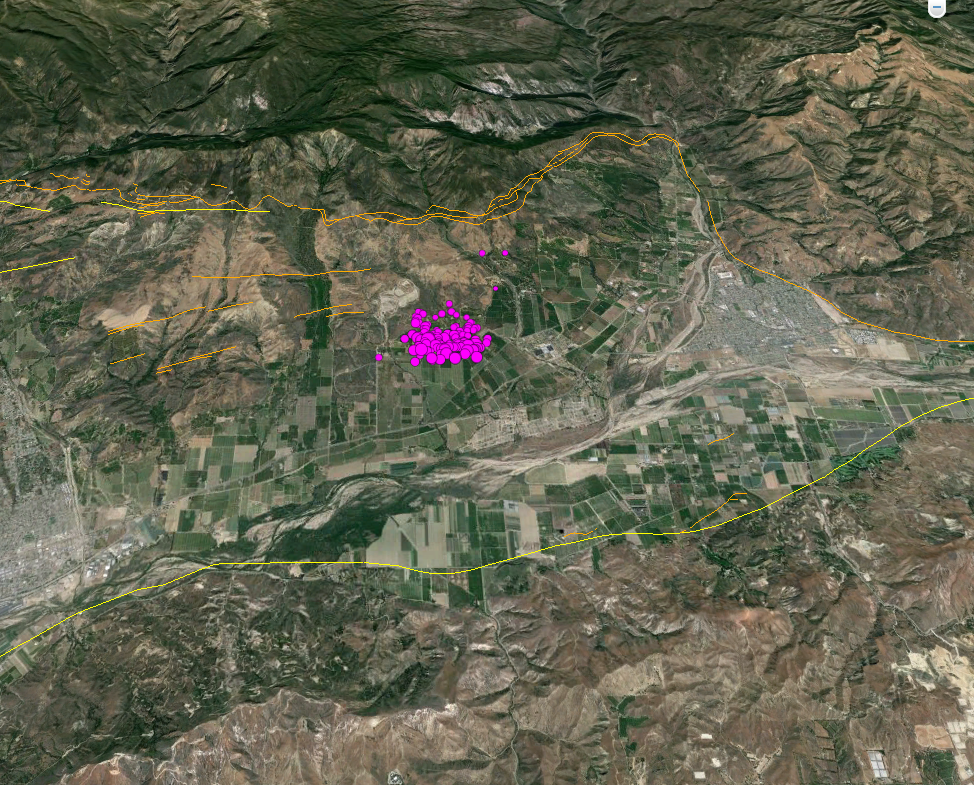
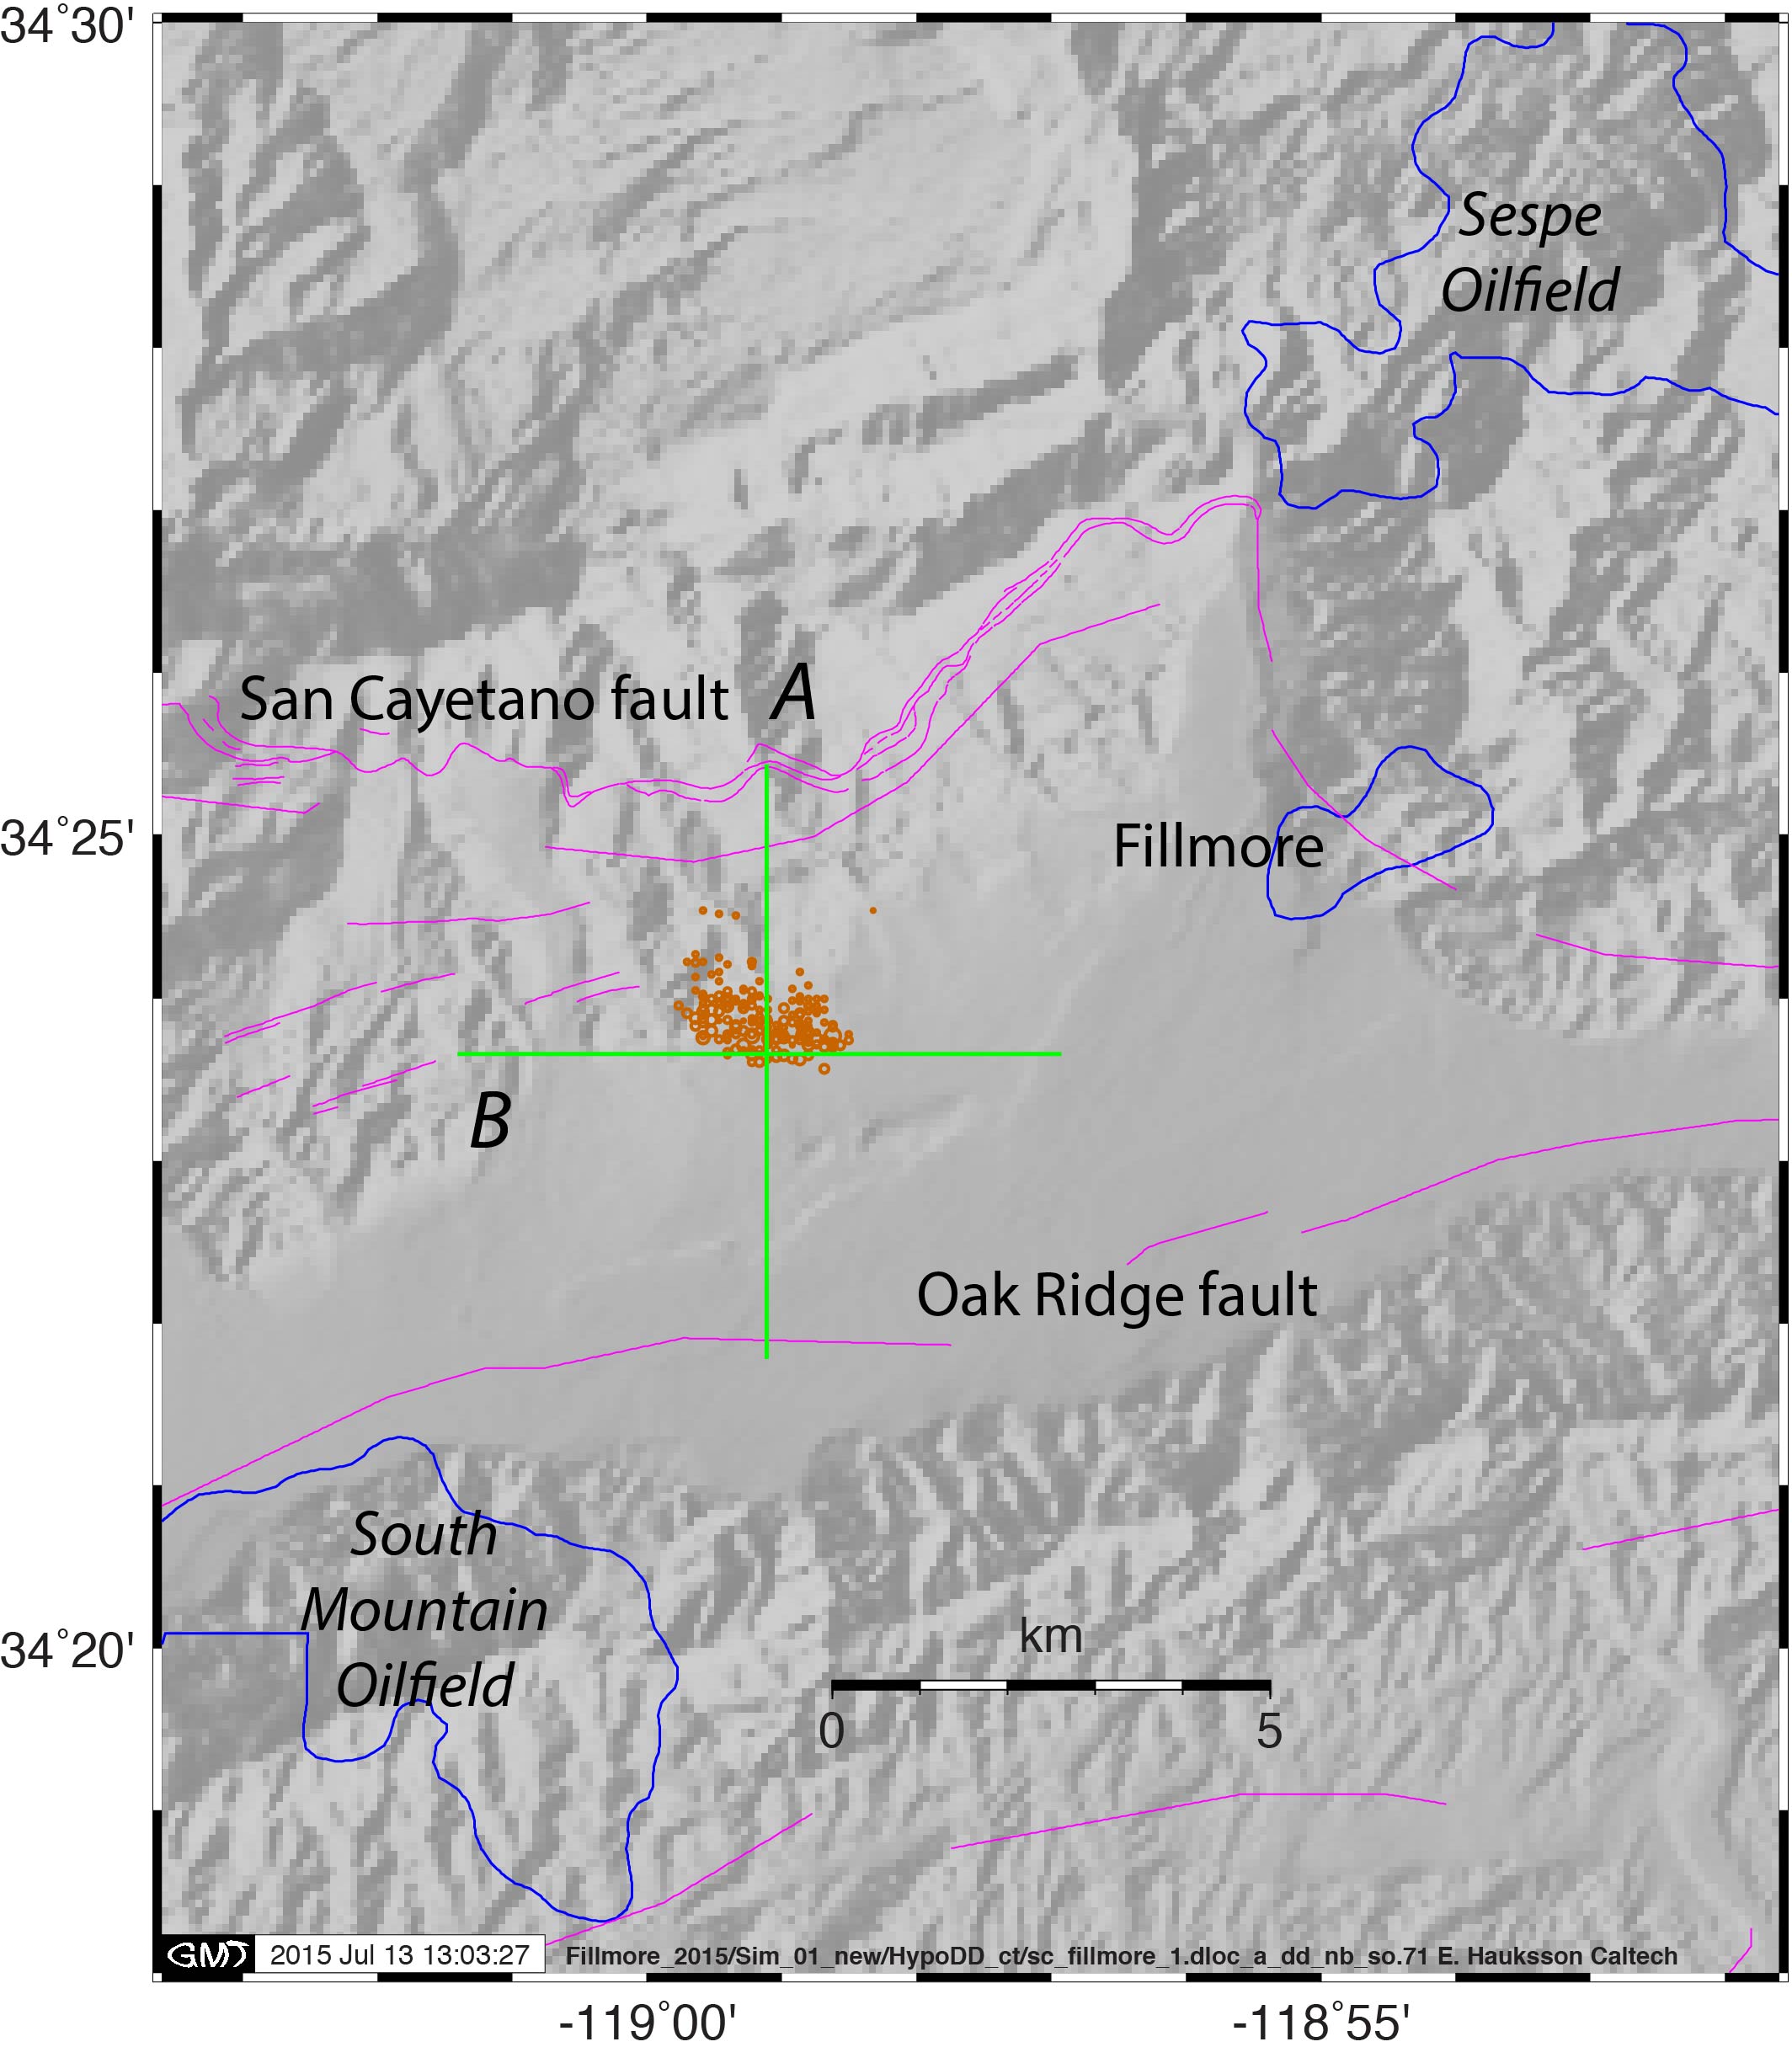
The swarm is located about 3 miles west of the City of Fillmore, in farming areas in the middle of the Ventura basin.
These events are mostly not being felt because they are small and located away from an urban area.
The swarm is located about halfway in between the San Cayetano Fault and the Oak Ridge Fault. It does not appear to be associated with faults mapped at the surface in the region. The preliminary data indicate that the fault movement is mostly thrust faulting on northeast (or southwest) striking planes. This is also consistent with the trend of the epicenters.
These events are located about 8 to 14 km (5-9 miles) beneath the Earth’s surface and are occurring in an area of known active earthquake faults, both of which suggest that they are of tectonic origin. However, at this time, a direct connection to anthropogenic activity cannot be ruled out with complete certainty because more detailed research is needed.
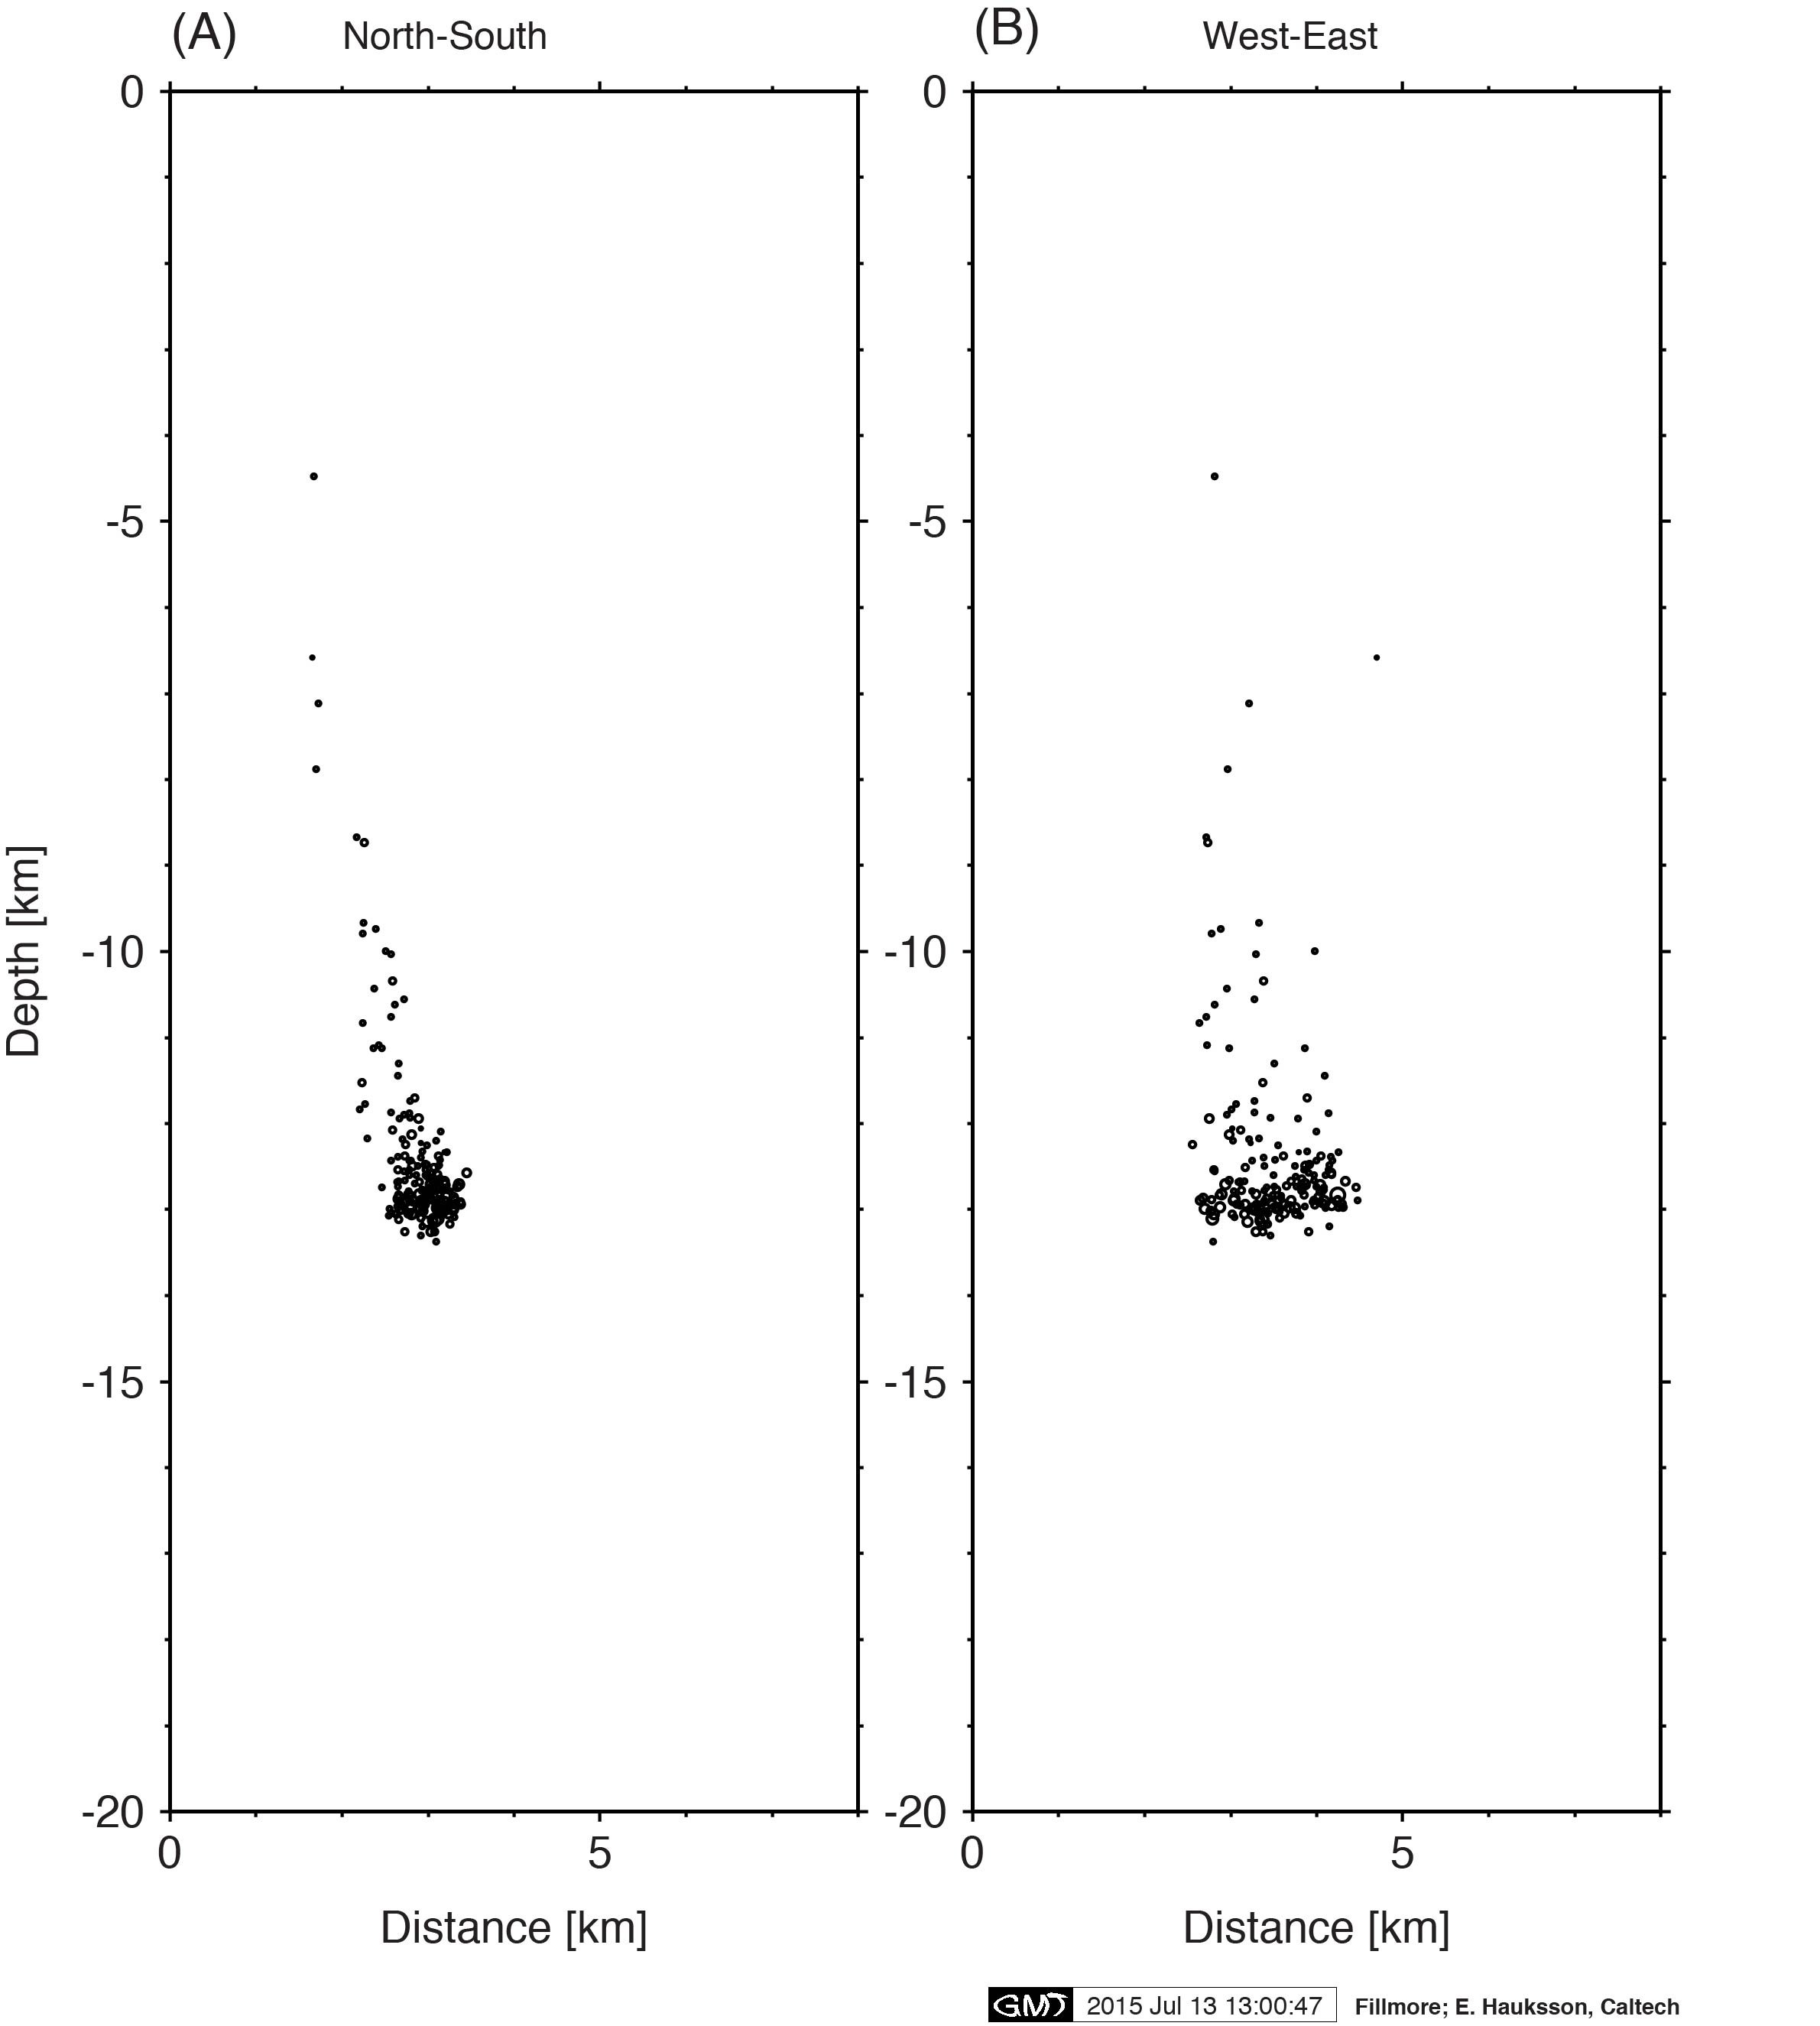
Since 1981 the SCSN has not recorded a similar earthquake swarm in the Ventura region. The large number of small earthquakes and lack of larger magnitude earthquakes of mag 3 or larger is very unusual. The swarm is slowly and inconsistently migrating to the northwest, under the Toland Road Landfill.
This earthquake swarm may be a reflection of fluid migration at depth or a slow slip event at depth, which could be caused by the compressional tectonics and high natural fluid pressures in the basin.
A kmz file showing the earthquakes and California faults can be found Here.
Caltech and USGS seismologists continue to monitor the situation real-time and will provide up-to-date information if there are significant new developments.
Dr. Jen Andrews (jrand@gps.caltech.edu) and Dr. Egill Hauksson, Caltech (hauksson@caltech.edu)