As part of the California Integrated Seismic Network (CISN) partnership, one of the primary means of distributing SCSN earthquake data to our partners and emergency managers is through the CISN display. The display uses multiple seismic network’s submitted data to continuously report any significant earthquake activity in California and additionally, the rest of the world.
Not recommended for viewing in Internet Explorer.
Viewing on a mobile device requires an active Facebook account and app.
For a description of what you are looking at visit the “What am I seeing” section below.
The live feed above displays a continuous live stream of earthquakes originating in California and their relevant data. While the map is centered on California, the information displayed at the bottom and right side of the frame will often display the latest earthquake information from around the globe as reported by the authoritative network. For more information on global earthquakes above magnitude 2.5 go to Latest Earthquakes on earthquake.usgs.gov For more information on this week’s seismicity in Southern California visit our Home Page.
About the CISN:
“Advances in technology have made it possible to integrate separate earthquake monitoring networks into a single seismic system as well as to unify earthquake monitoring instrumentation. In California, this effort began in the south with the TriNet Project. There, Caltech, the California Geological Survey (CGS), and the USGS created a unified seismic system for Southern California.
With major funding provided by the Federal Emergency Management Agency (FEMA), the California Governor’s Emergency Management Agency (CalEMA), and the USGS, monitoring infrastructure was upgraded and expanded, combining resources in a federal, state and university partnership. In 2000, the integration effort expanded to the entire state with the formation of the California Integrated Seismic Network (CISN, see 2000-2001 Annual Report). To this end, UC Berkeley and the USGS Menlo Park and Pasadena offices joined forces with Caltech and the CGS.” – cisn.org
What am I seeing:
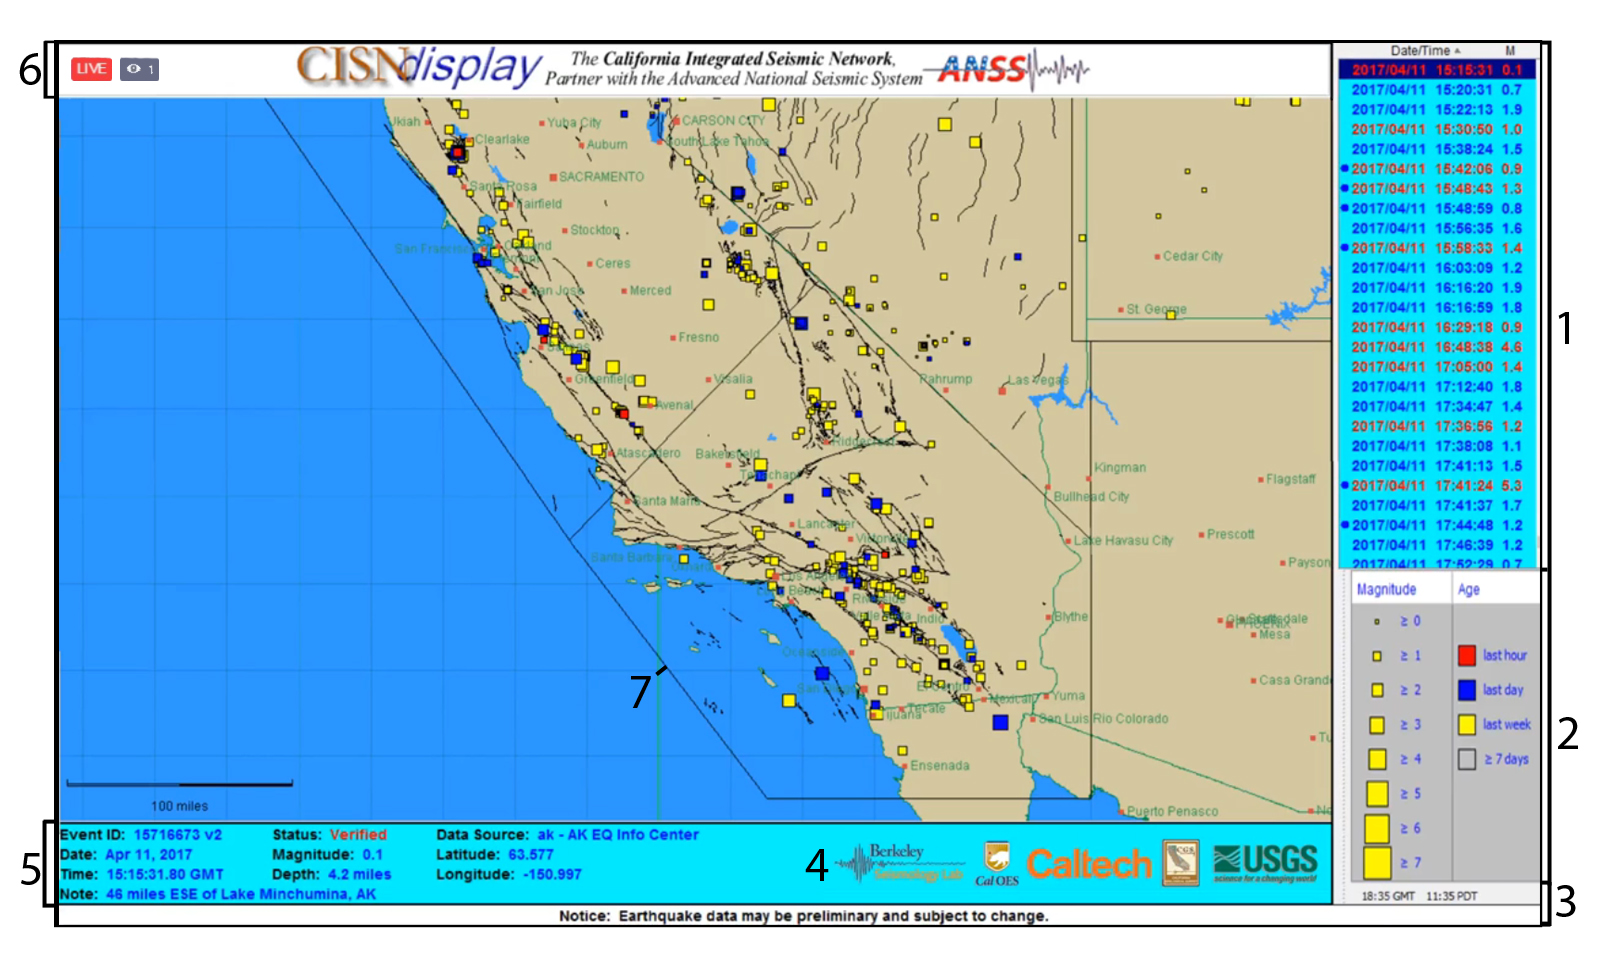
- Recent Events List: The list within this panel indicates the most recent earthquakes to be reported globally. The events are listed by date and time YYYY/MM/DD HH:MM:SS in GMT/UTC followed by magnitude. A description of the colors and what they mean is below:
- Text-Blue: Indicates that the data displayed is an automated preliminary solution often meaning that the event has not been reviewed for validity and/or accuracy yet.
- Text-Red: Indicates that the solution has been reviewed in some capacity by a human. The information may not be the final solution but the event has moved past the automated solution.
- Background-Dark Blue: The event highlighted with a dark blue background corresponds to the event being displayed in the bottom panel (Point 5)
- Symbols: The symbols to the left of the list text indicate that a product has been generated for internal use by appropriate agencies, e.g. shakemap, hazard assessment, etc.
- Map Legend: This legend displays the magnitude and age of the events displayed on the map, indicated by icon size and color as described within the panel.
- Time and Disclaimer: The bottom of the feed indicates the current time in GMT and PDT as well as the preliminary data disclaimer.
- Funding Partner Logos: Cal State Berkeley, The California Office of Emergency Services, Caltech, California Geological Survey, and the United States Geological Survey are all major contributors to the creation and maintenance of the CISN Display. For more information on the funding partners and the CISN display itself visit www.cisn.org
- Featured Event Display: The information provided in this panel is reflective of the event highlighted in the Recent Events List (Point 1) and displays the magnitude, depth, location (gps and geopolitical description), authoritative seismic network, status, and event ID. If the event being displayed is located within the map area it will be marked with an arrowhead icon.
- Header and Live indicator: The red “Live” icon indicates that the feed is indeed live and running in real time. The eye icon represents how many people are currently being counted as viewing the stream in Facebook. Adjacent to the live indicator is the main header with branding that shows the program name, logos, and partner system.
- Network Boundaries: Each seismic network has a set boundary with reporting requirements pertaining to their geographic region. The black lines displayed on this map indicate the different regions of authority in and around California, with the Southern California border housing the Southern California Seismic Network’s reporting region.