
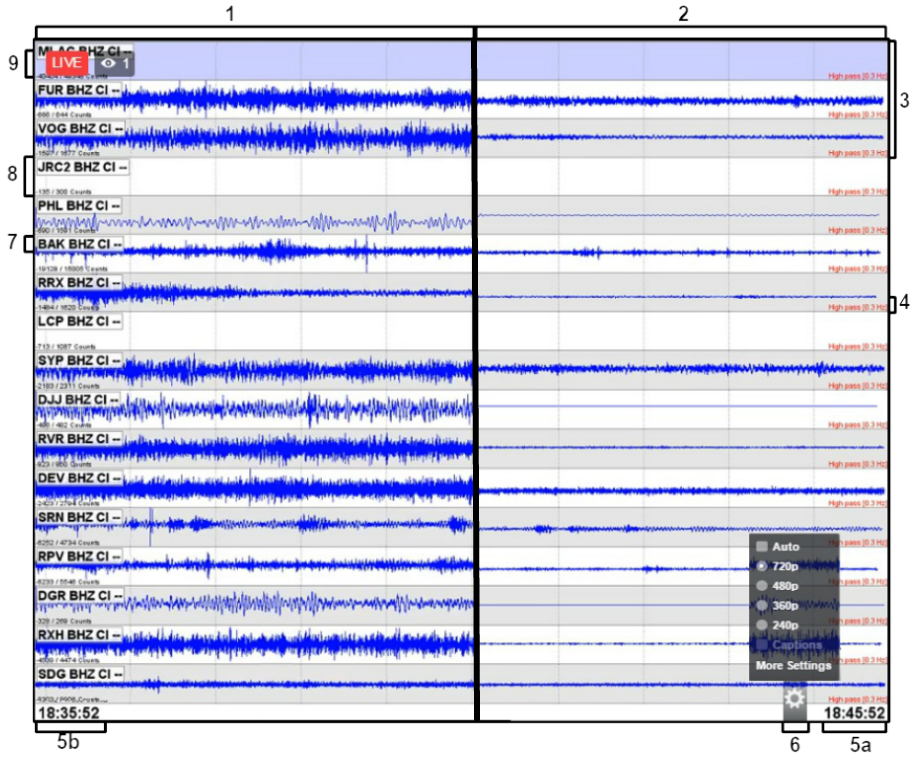
- Waveforms – Amplitude Unscaled: Amplitude scaling occurs when the waveviewer compensates for higher amplitude waveforms entering the field of view by downscaling the rest of the wave. This scaling is done so as not to saturate the window. When a large amplitude signal passes through, either “noise” or an event, the waveform eventually scales enough to become a flat line, as seen in section 2. This unscaled view in section 1 displays typical noise signals (present at every seismic installation) prior to a larger amplitude signal entering the window.
- Waveforms – Amplitude AutoScaled: As described for section 1, these autoscaled waveforms in section 2 have “flat-lined” due to a larger amplitude signal passing through (and no longer visible in the window). Because the autoscaling makes it difficult to see any small events after a larger signal has passed through, scaling is automatically reset every 10 minutes to allow for more frequent small magnitude signals to be viewed.
- Channel Window Coloration: The three channels selected in this example all have different background colors. The grey and white backgrounds serve no purpose other than as an aid in distinguishing between the separate rows in the display. The blue background is a highlighted channel and is the product of a technician working with the program to maintain the stream view.
- High Pass Filter: A high pass filter of 0.3Hz is applied to all of the channels in order to filter out low frequency noise. The cut-off frequency was selected to significantly reduce one of our dominant microseism noises sources: the ocean waves hitting the coastline. The reduction in low frequency noise creates a cleaner viewing experience, allowing legitimate earthquake signals to be easier to view.
- This set of seismograms displays a 10 minute window of time, with a 1 second refresh rate. In this seismogram view, data streams from right to left, i.e. data on the left side of the screen are older than data on the right side of the screen.
- Clock: Time Signal of data arriving on viewer. This right side clock is the timestamp of data just arriving within the viewer. Seismic data are recorded in Universal Co-ordinated Time (UTC), which is 8 hours ahead of Pacific Time in the winter, Pacific Standard Time (PST), and 7 hours ahead in the summer, Pacific Daylight Time (PDT).
- Clock: Time Signal of data leaving the viewer. The left side clock is the timestamp of data about to leave the viewer.
- Resolution Settings: For the best video quality click the gear in the bottom right corner and select “720p”. If left unselected the default will be set to “Auto” which will drop the resolution to your browsers preferred setting, often making the feed look “blurry”.
- Channel Name: Each channel represented within this viewer is from a different seismic station in Southern California. The label represents the station name, e.g. “BAK” for a site in Bakersfield, the channel type “BHZ” (using the SEED format convention this is a low sample rate, vertical channel with high gain), and the network ownership, e.g. “CI” for SCSN.
- Offline Channel: Due to the large number of seismic installations throughout Southern California and the wide variety of environments in which they are located, occasionally a station will go offline. These offline stations are usually awaiting repair from a technician and will be brought back online as soon as possible. For more information on our stations visit our Network page.
- Live Indicator: The red “Live” icon indicates that the feed is indeed live and running in real time. This indicator has been moved to the bottom next to the play button.

Below is a playlist of Live Seismograms Feed recordings. Each recording displays a window of time corresponding to the detection of either a local earthquake above magnitude 3.0 or a teleseismic event from somewhere around the world. Note that the normal background “noise” signals are supressed when a legitimate event’s energy is detected by the seismometers, leaving just the earthquake’s energy visible. More examples will be added as significant events are detected.