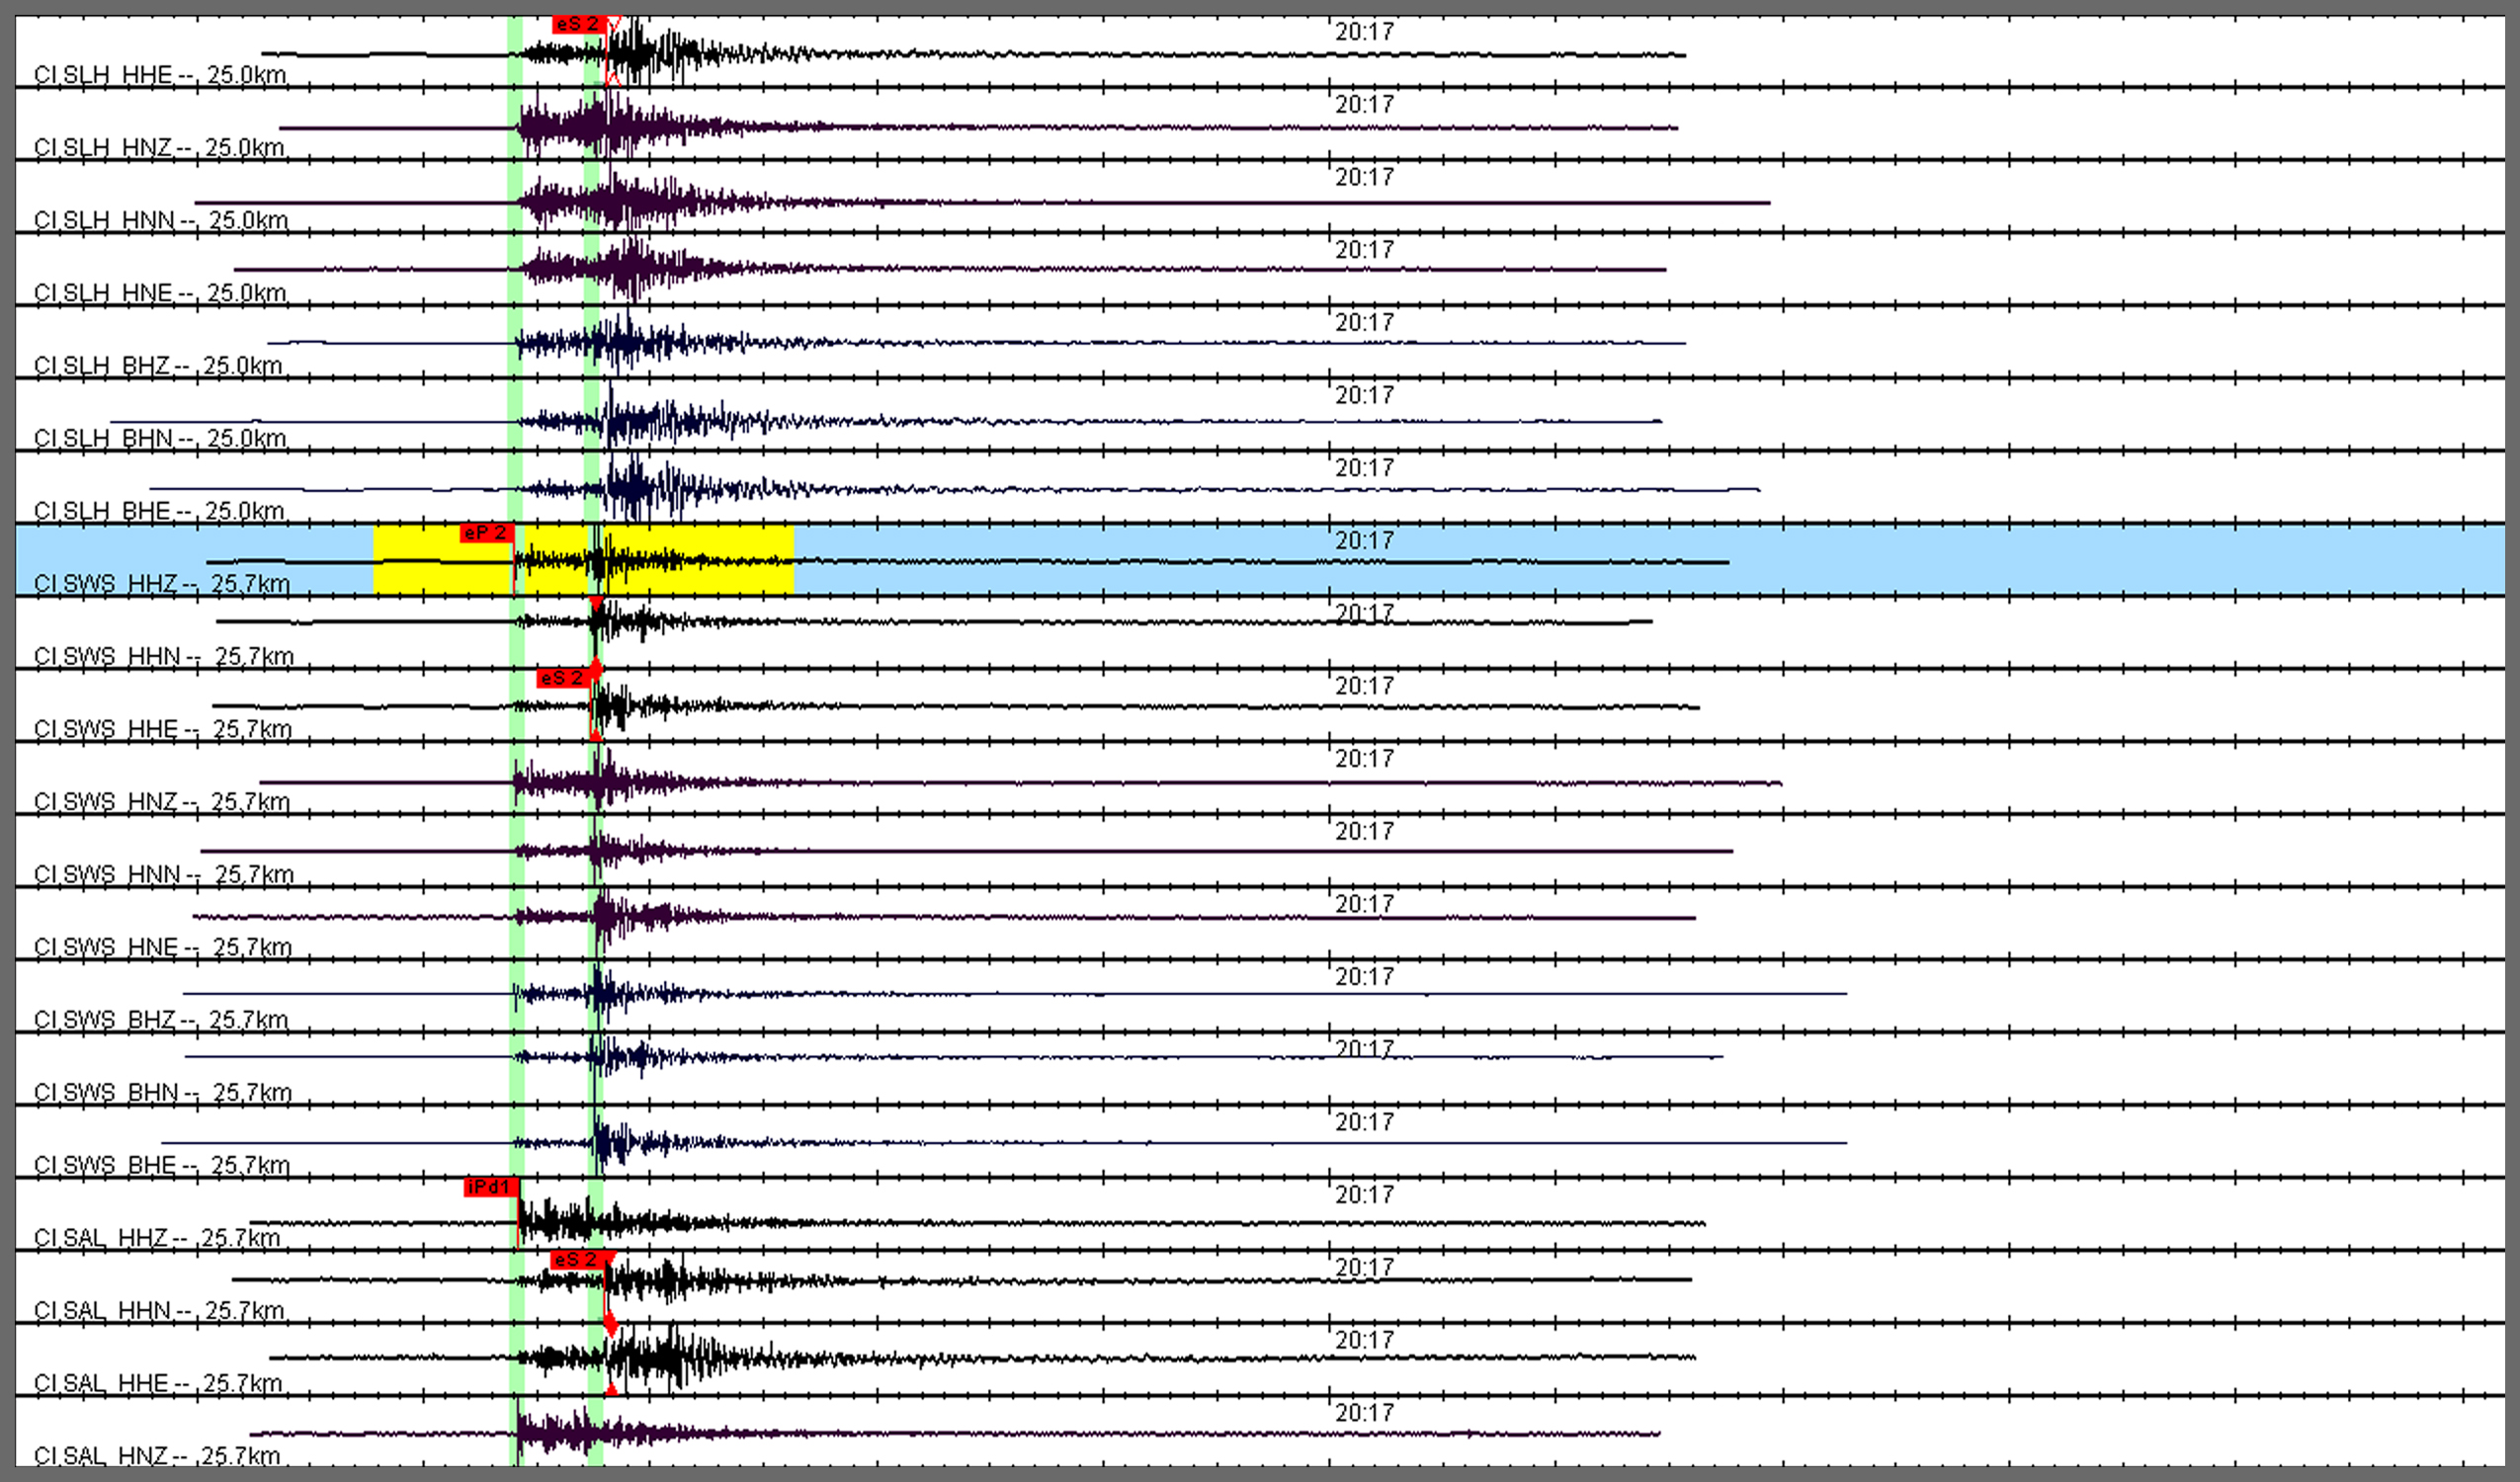

The energy shown here is from a typical earthquake located within the SCSN boundaries. The distinctive smaller P-wave and larger S-wave detected across numerous seismic stations is typical of local events within Southern California. These are the most common type of event detected by our network, commonly averaging 300 of this type of event each week.
Below is a recording of our live stream depicting a local event that occurred on 2017/03/01 at 20:18:39 UTC Near Salton City, Ca.
Note that the waveforms enter the window first in the southern most stations, and generally come in later in time as you look north. For more information about this event go to 03/01/2017, M3.5 event near Salton City
The information and video below was provided by USGS and can be found at https://earthquake.usgs.gov/
This video displays 2 major concepts: the first concept, attenuation, as described by USGS is “When you throw a pebble in a pond, it makes waves on the surface that move out from the place where the pebble entered the water. The waves are largest where they are formed and gradually get smaller as they move away. This decrease in size, or amplitude, of the waves is called attenuation. Seismic waves also become attenuated as they move away from the earthquake source”; the second concept is actually a good visual depiction of how the earthquake waves travel and are translated into waveforms for analysis.


