
Understanding Seismic Waveforms Graphically
Below are some examples of the most commonly analyzed earthquakes and ground motion in Southern California. The waveforms that you see below have been isolated to demonstrate graphically what a single seismic station in our network would feel when the named type of event passes through it. When you click on the waveforms, a larger window will display multiple stations’ data, some with the P and S-waves identified.
The larger window displays how these events are actually analyzed and provides additional information. Data from a single station doesn’t tell very much (or rather there is a high uncertainty on the results we can calculate from it), but for an actual earthquake when you line up the data from multiple stations around the network you can see how the energy moved through the earth and determine its location, depth, magnitude, and sometimes how the fault moved.
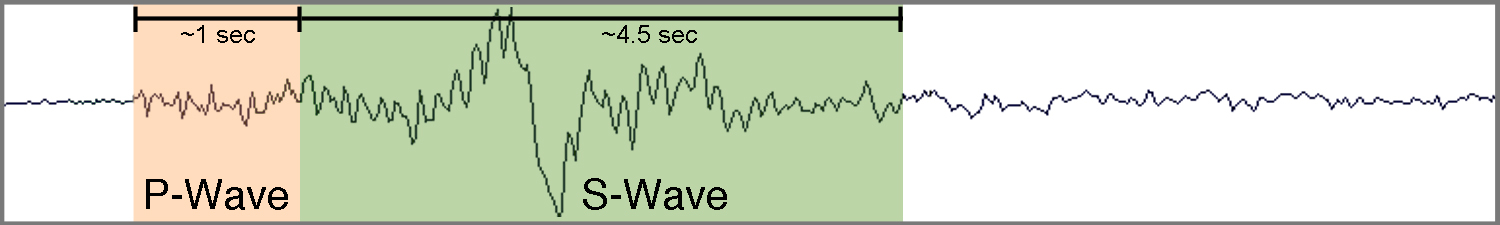
Local Earthquake

The energy shown here is from a typical earthquake located within the SCSN boundaries.
Quarry Blast
The energy shown here is from a quarry blast located within the SCSN boundaries. Due to mining operations in Southern California we commonly detect blasting that is used in mining operations. Quarry blasts often show a “ringy” (long duration) and low-frequency S-wave making them easily separated from typical local events.
Teleseismic Event
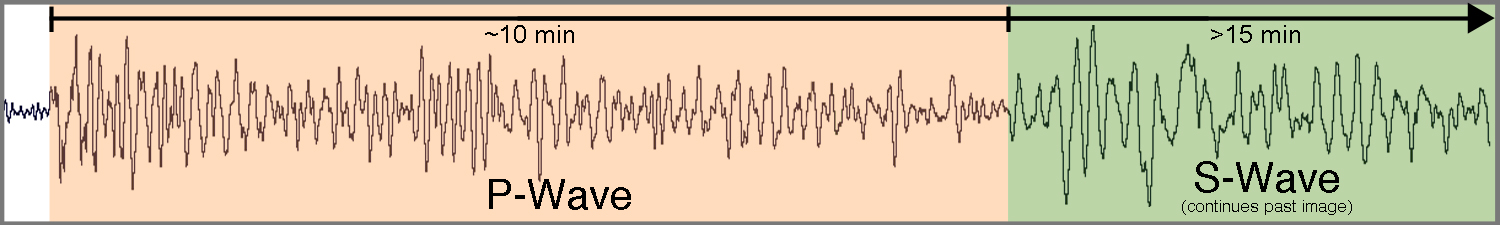
The energy shown here is from a large magnitude earthquake located outside the SCSN boundaries. It is common for our network to detect these large earthquakes that start commonly around the borders of the Pacific Ocean. The distinguishing features are long-period waves that tend to almost uniformly hit our entire network around the same time.
Sonic Boom
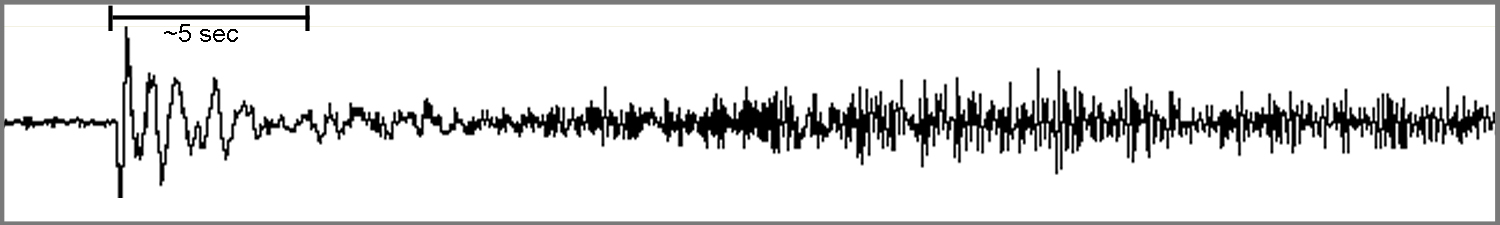
The energy shown here is from a sonic boom located within the SCSN boundaries. Because there are military bases around Southern California, we often detect sonic booms from test flights and training runs etc. The most common feature of sonic booms in our data is a large initial wave sometimes followed by an almost identical wave. These waves don’t generally line up and spread out evenly like earthquake waves because our equipment and models aren’t calibrated to compensate for energy moving through the atmosphere instead of the ground below. Though aircraft sonic booms are common, this particular one is from the Nov. 6, 2013 meteor that was seen above California, Arizona, Nevada, and Utah.
Rocket Launch
The energy shown here is from a SpaceX rocket launch located within the SCSN boundaries. Because Southern California is home to Vandenburg Air Force Base (near Santa Maria), we occasionally detect the take-off of rockets set to go into space. The most notable feature of these launches in our data is that it lacks distinct seismic phases, and differs in both the duration of the energy signal and the speed at which it reaches different sensors in our network. This launch waveform is from the Sept. 13, 2021 SpaceX mission of sending 51 Starlink satellites into orbit.
Military Training: Artillery Fire
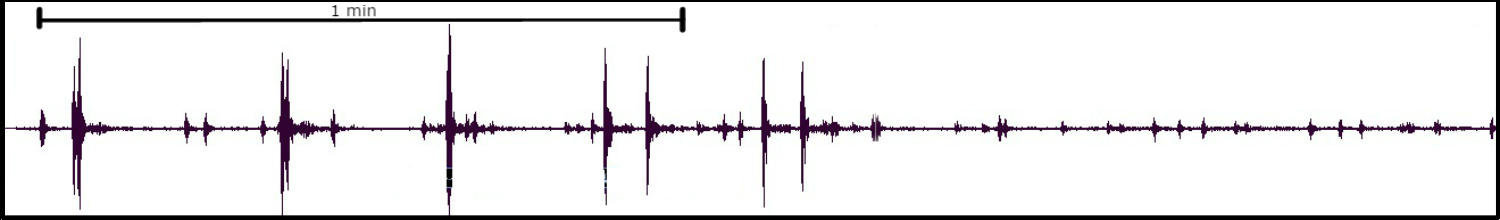
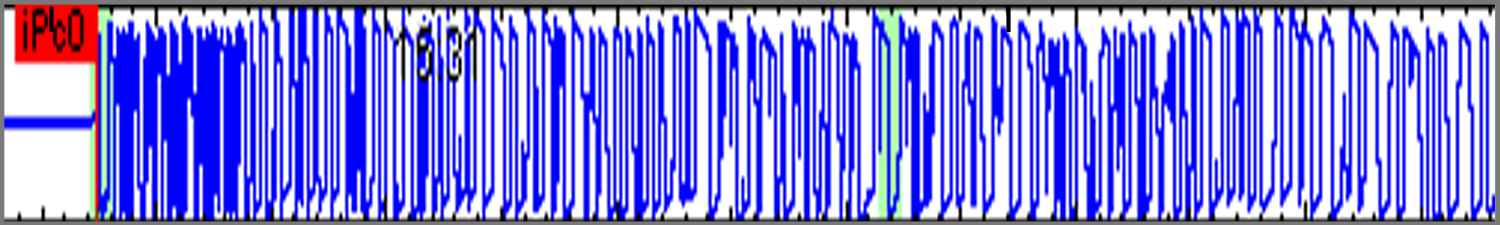
The energy shown here is from multiple artillery shots fired during training at Camp Pendleton in Southern California. What makes these waveforms interesting is that there are so many distinct impulsive signals clustered in time with a very slow move-out, which can be seen in the expanded view. Move-out is a term used to describe the amount of time it takes for the waves to go from one station to the next and can be converted into the actual speed of the waves, in this case the sonic waves produced by the shots fired traveled at 235m/s. Normally the speed of a sonic boom is the speed of sound, which is 343m/s in dry air at 20°c, but due to real-world atmospheric conditions the value is lower. Click on the isolated waveform for more information and the noise advisory released by Camp Pendleton
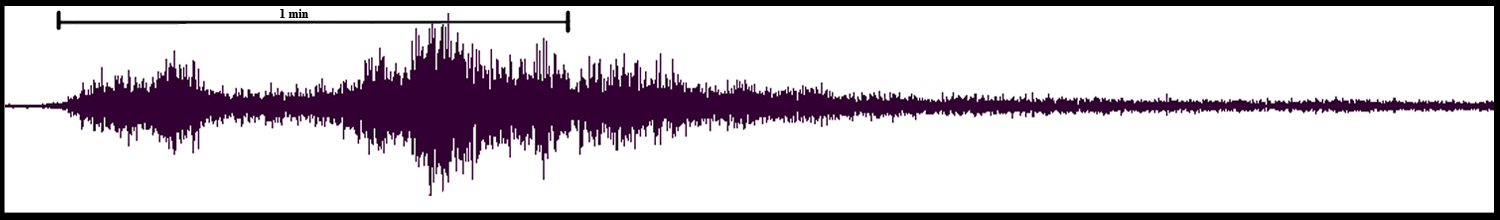
Military Testing: Nuclear Blast
This is a waveform from Bomb “Montello” on April 1991, which generated a blast with the equivalent seismic energy of a M5.06 earthquake felt by the network. Note that this window is representing roughly 1 minute of time but the waveform is energetic enough that it was felt by the network for many minutes, which can be seen in the comprehensive view.
Below is a playlist of Live Seismograms Feed recordings. Each recording displays a window of time corresponding to the detection of either a local earthquake above magnitude 3.0 or a teleseismic event from somewhere around the world. Note that the normal background “noise” signals are supressed when a legitimate event’s energy is detected by the seismometers, leaving just the earthquake’s energy visible. More examples will be added as significant events are detected.