
What is Distributed Acoustic Sensing (DAS)
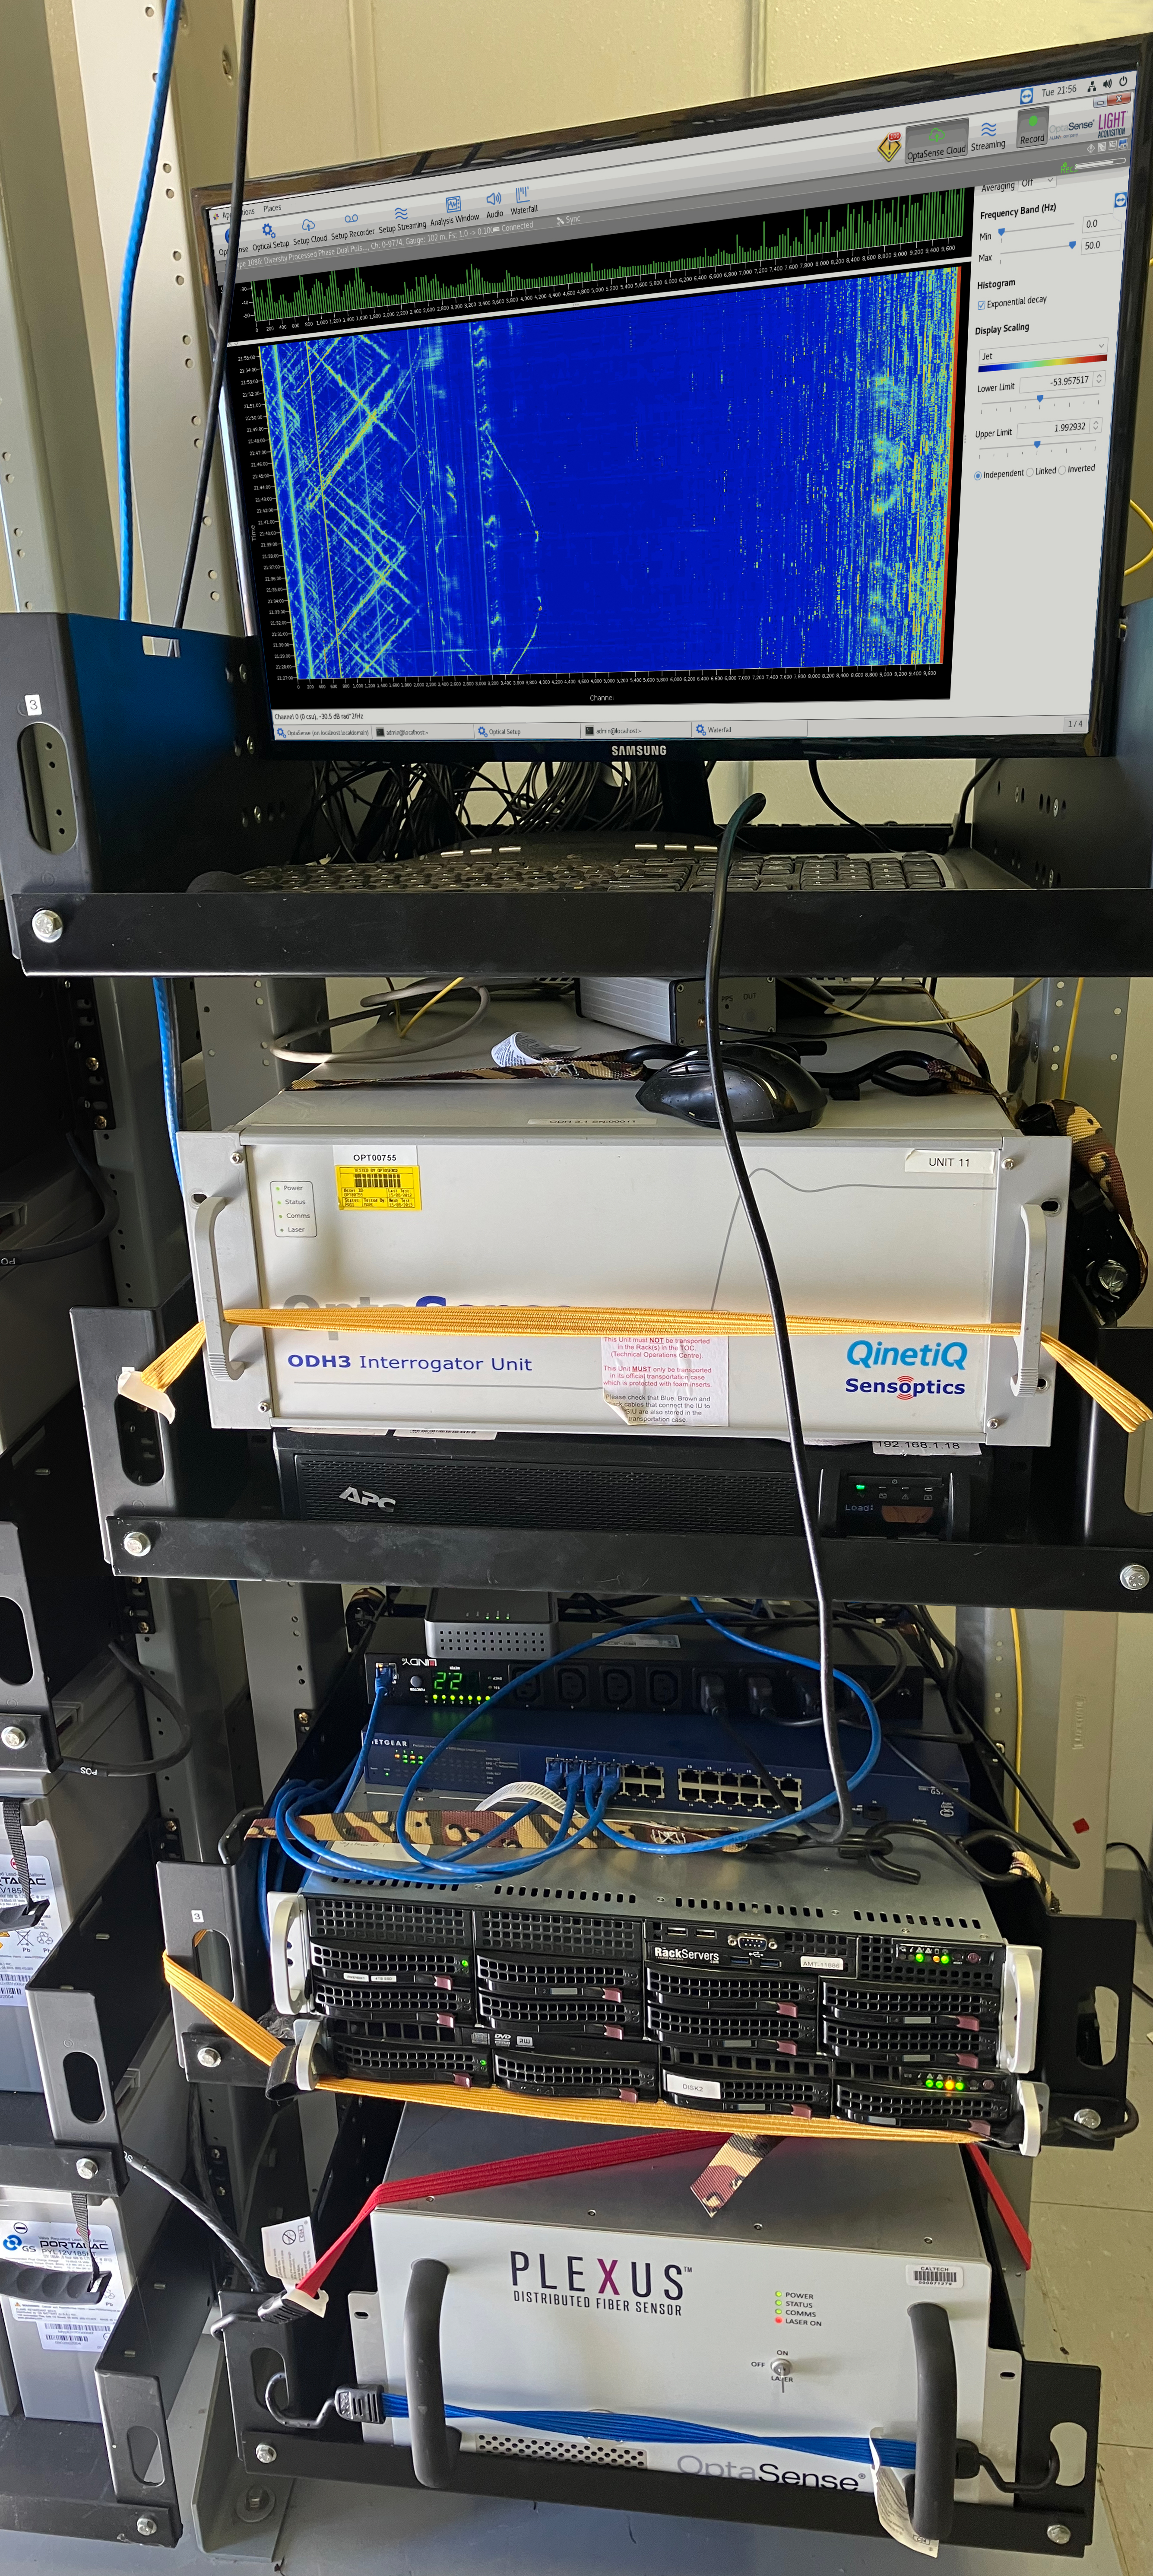 |
DAS utilizes existing underground fiber optic cables, which are installed, owned, and operated by private telecommunication companies. This technology involves connecting a laser transmitter and sensor unit, seen here, to the fiber optic line, similar to connecting a modem and computer to a cable to access the internet. Laser pulses are transmitted down the cable,and tiny imperfections in the fiber optic cable reflect the laser light back to the sensor unit. Any ground motion, such as earthquakes or human activities, in the vicinity of the buried cable causes it to flex and move in tandem with the surrounding material. This flexing (aka deformation) affects how the laser light is reflected back and recorded by the sensor. To measure the shaking-induced deformation on a given section of the cable, the length of the cable is divided into a series of channels, about 8200 in our display, that each reflects/scatters the laser light back from different distances. The measurements are made using an interferometric algorithm and displayed as a waterfall plot, which you can view in the live stream. The equipment pictured to the left is the extent of the instrumentation required to run a DAS array, which is the equivalent of installing roughly 10,000 traditional seismic sensors. The equipment consists of an OptaSense sensor to transmit and receive laser pulses along the connected fiber cable, a server setup for processing the data, and a monitor for maintenance and adjustments. The data is then sent over the internet to Caltech where the SCSN and researchers can access it. |
Interpreting the Waterfall Display
Below are examples of different events that are often visible on the live waterfall feed and how to interpret them. Click on any of the images to view the Understanding DAS page with more example images and information.
Earthquakes
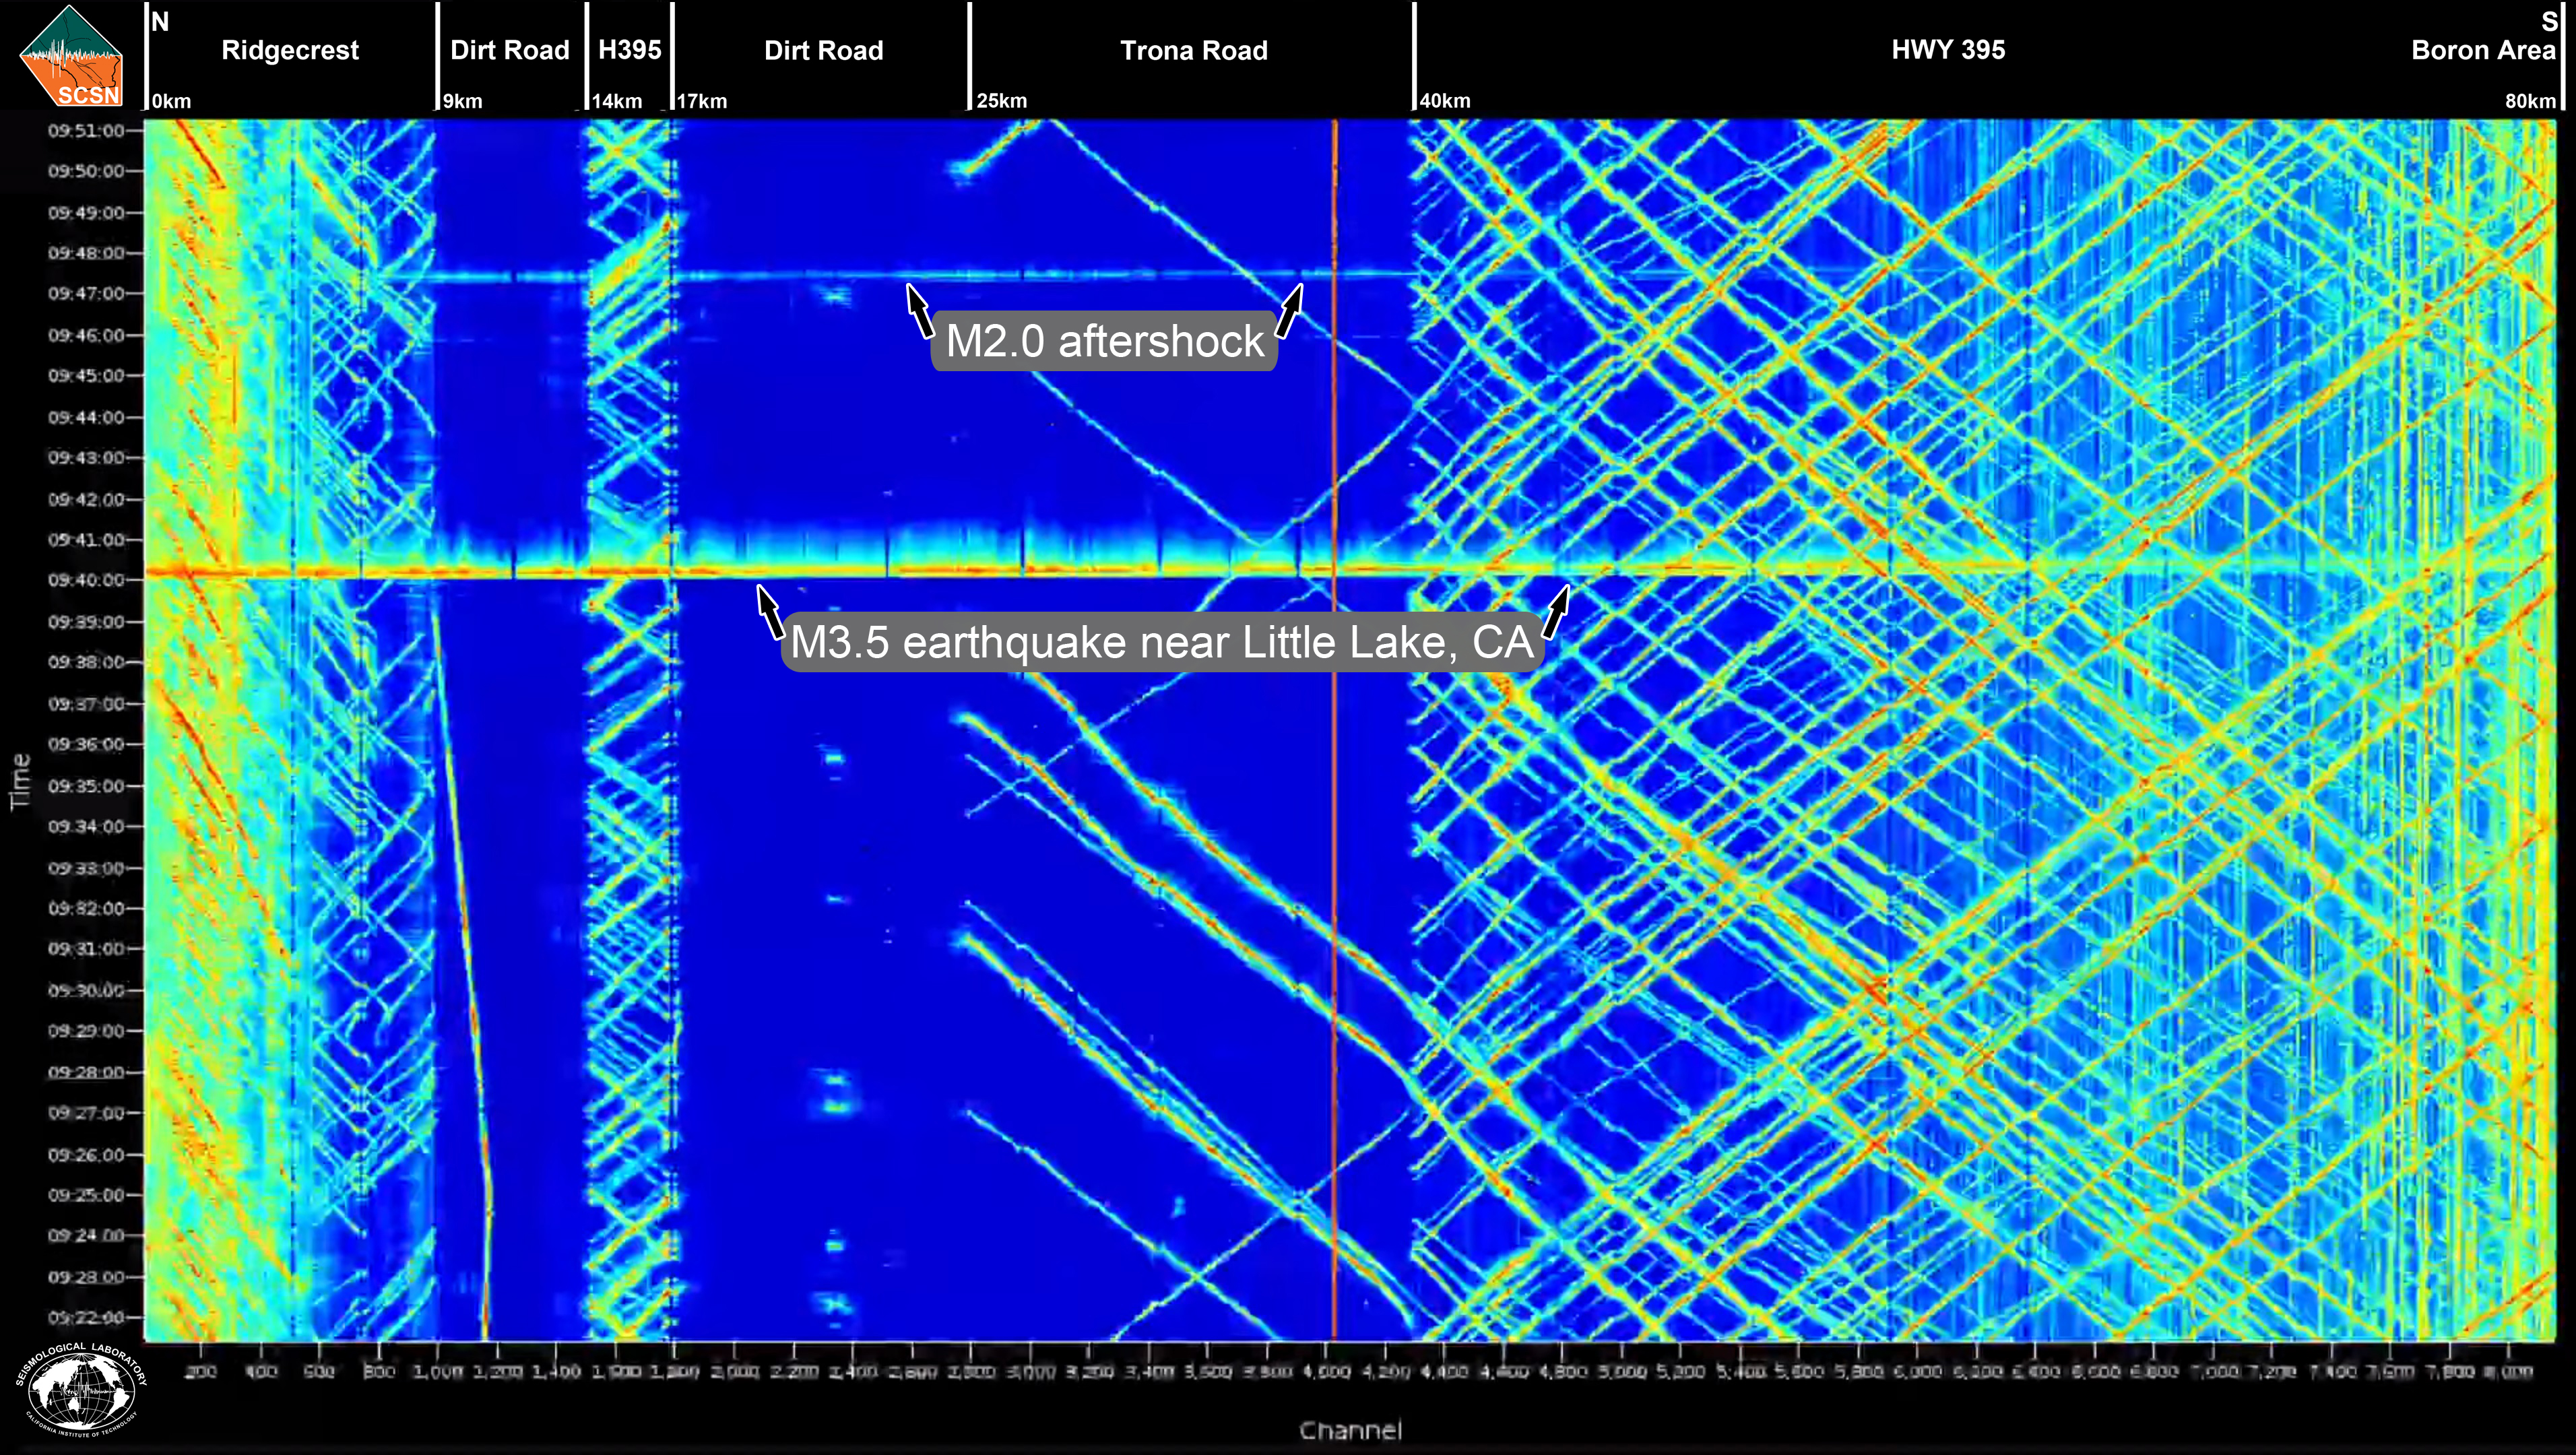
A magnitude 3.5 earthquake recorded on the Ridgecrest DAS array feed. The event located in Little Lake, CA, occurred on 2023/10/26 and shows a clear, nearly horizontal signal that is distinctly different from other types of signals that are commonly observed. A small aftershock is visible above (aka after) the M3.5 event. Because of the velocity that earthquake waves travel through the ground, earthquake signals appear as nearly horizontal lines at this 120-minute time scale.
Day/Night Cycle and Highway Traffic
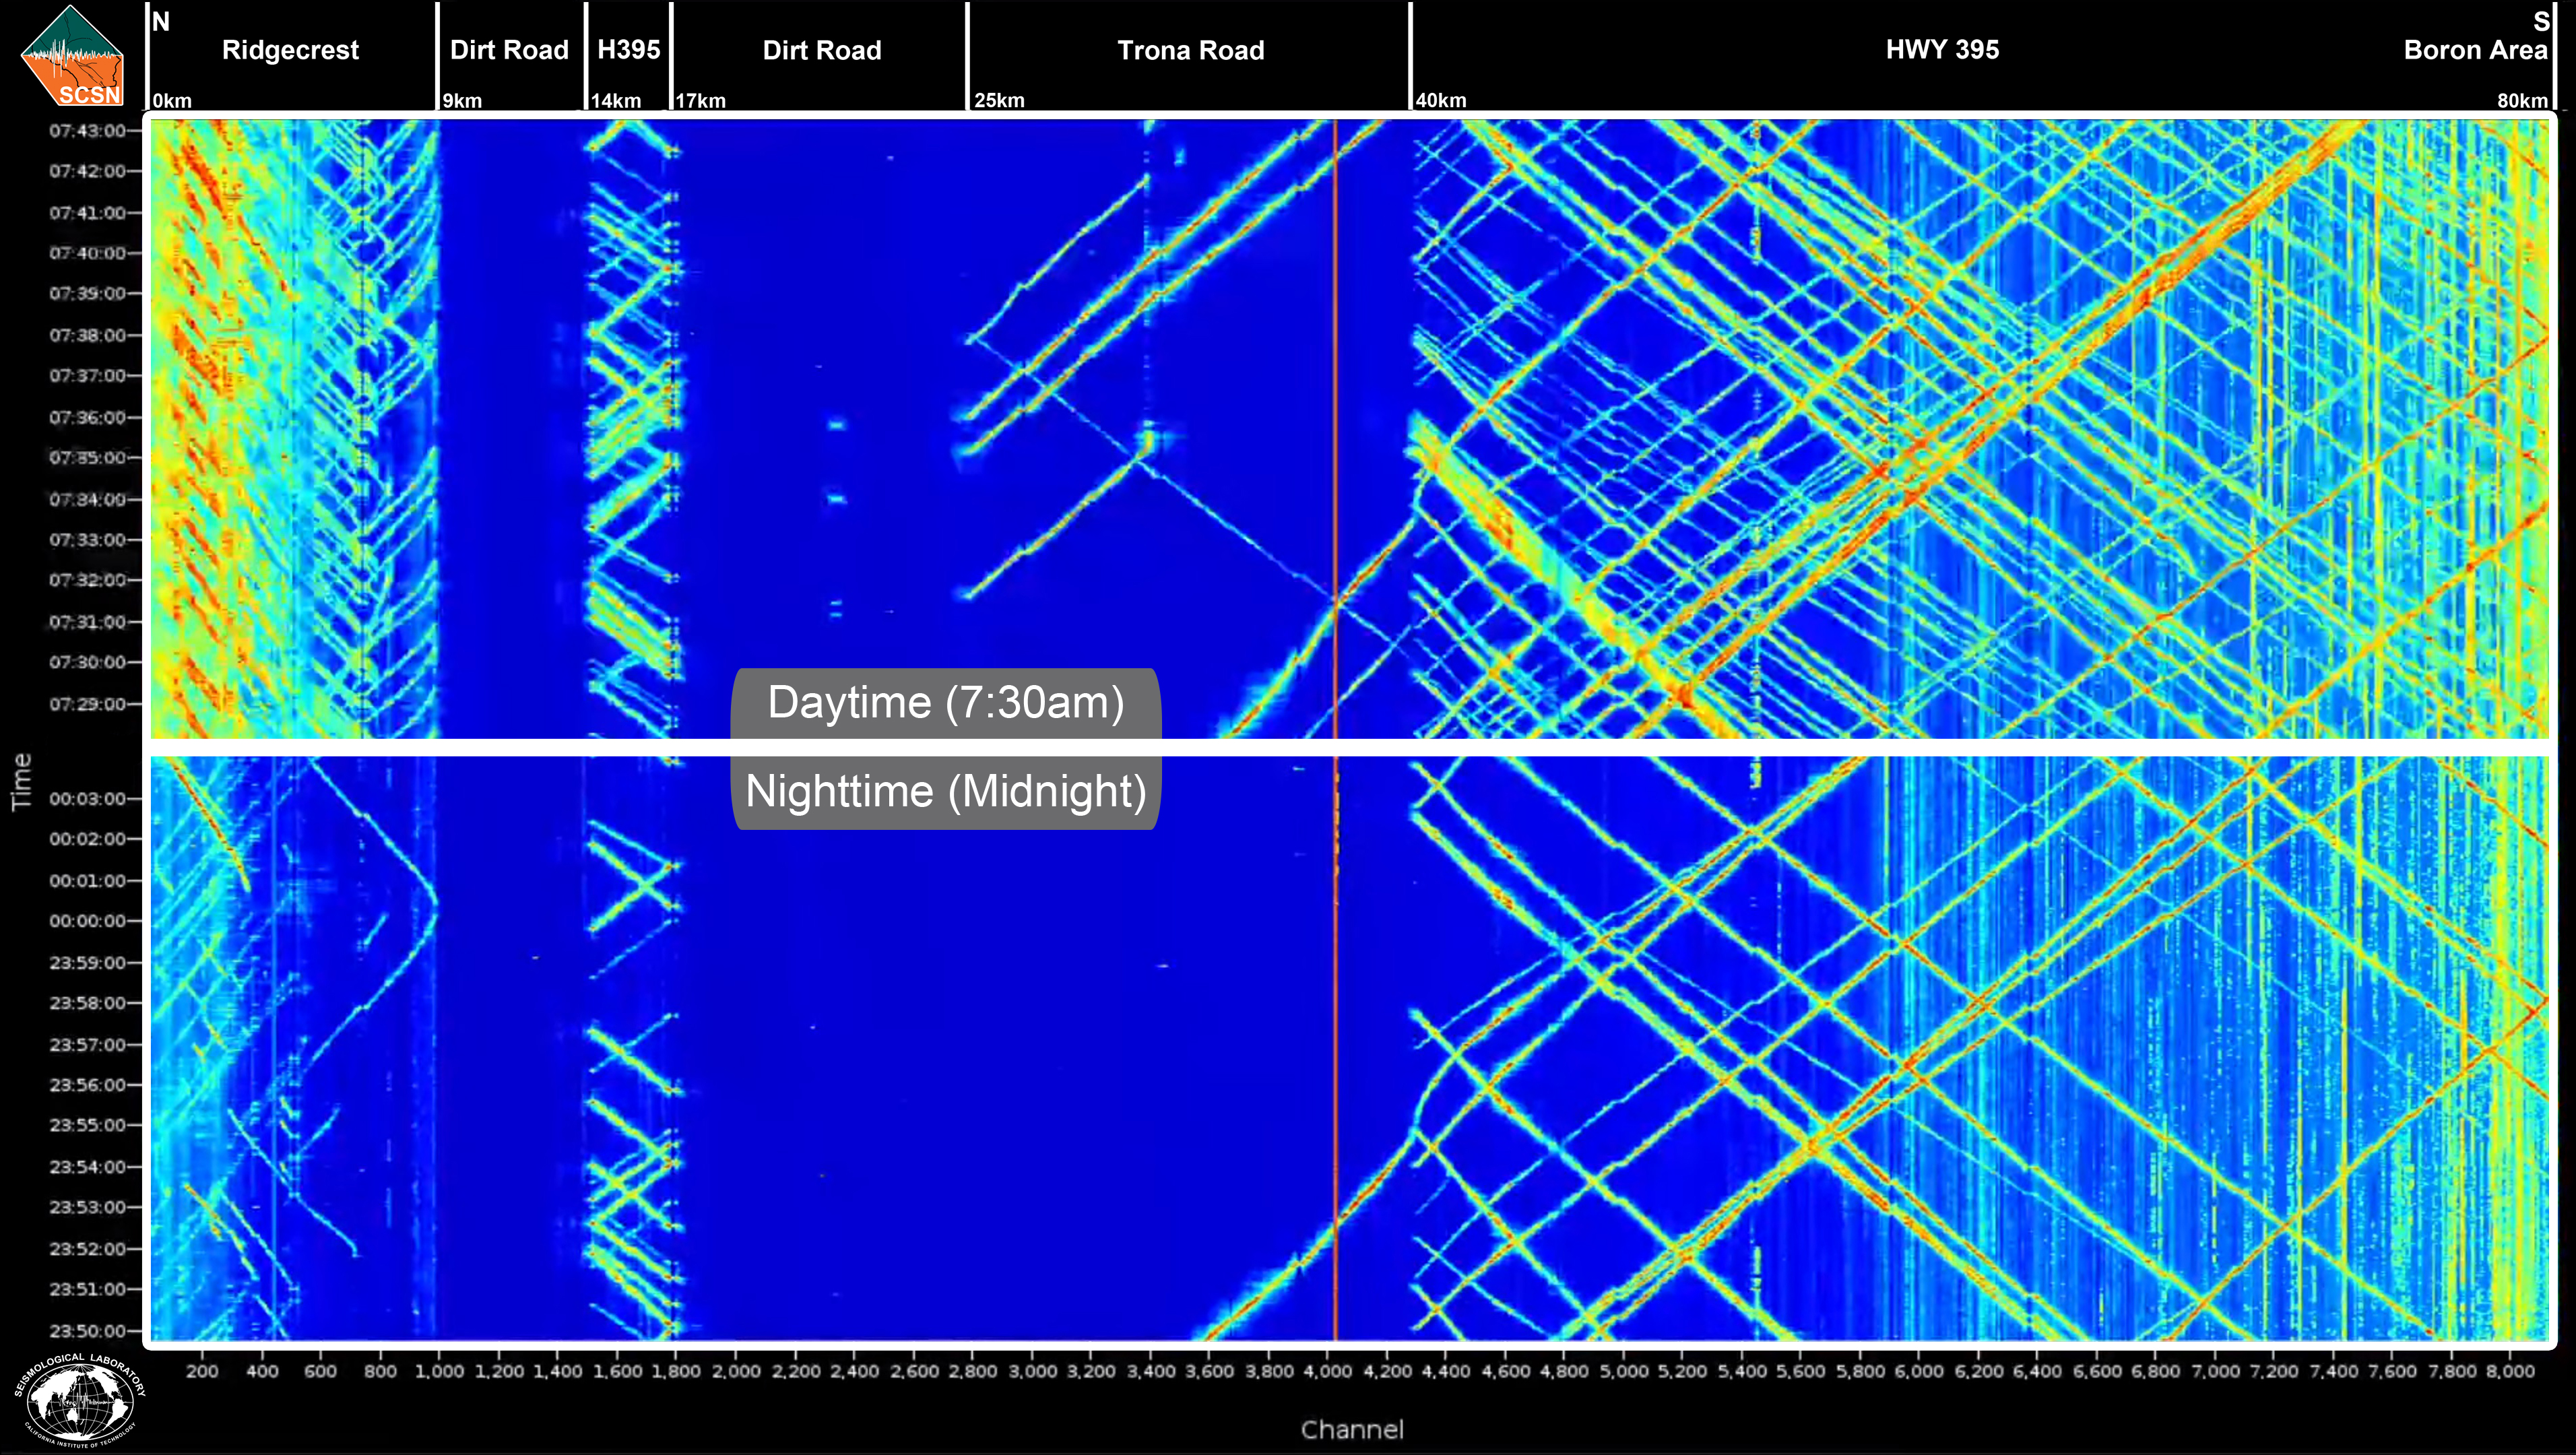
Because the array runs along Highway 395 through cities and the open desert as a major transportation corridor, the time of day heavily influences the activity visible on the DAS feed. The most prominent and constant features of the DAS stream are the 30°-50° lines. These lines, visible most commonly on the highway and near the cities, represent the shaking produced by vehicles. More vehicles are on the road during daylight hours, so there are usually more 30°-50° lines brightening up the display during the day, making the display appear drastically different than at night.
Trains
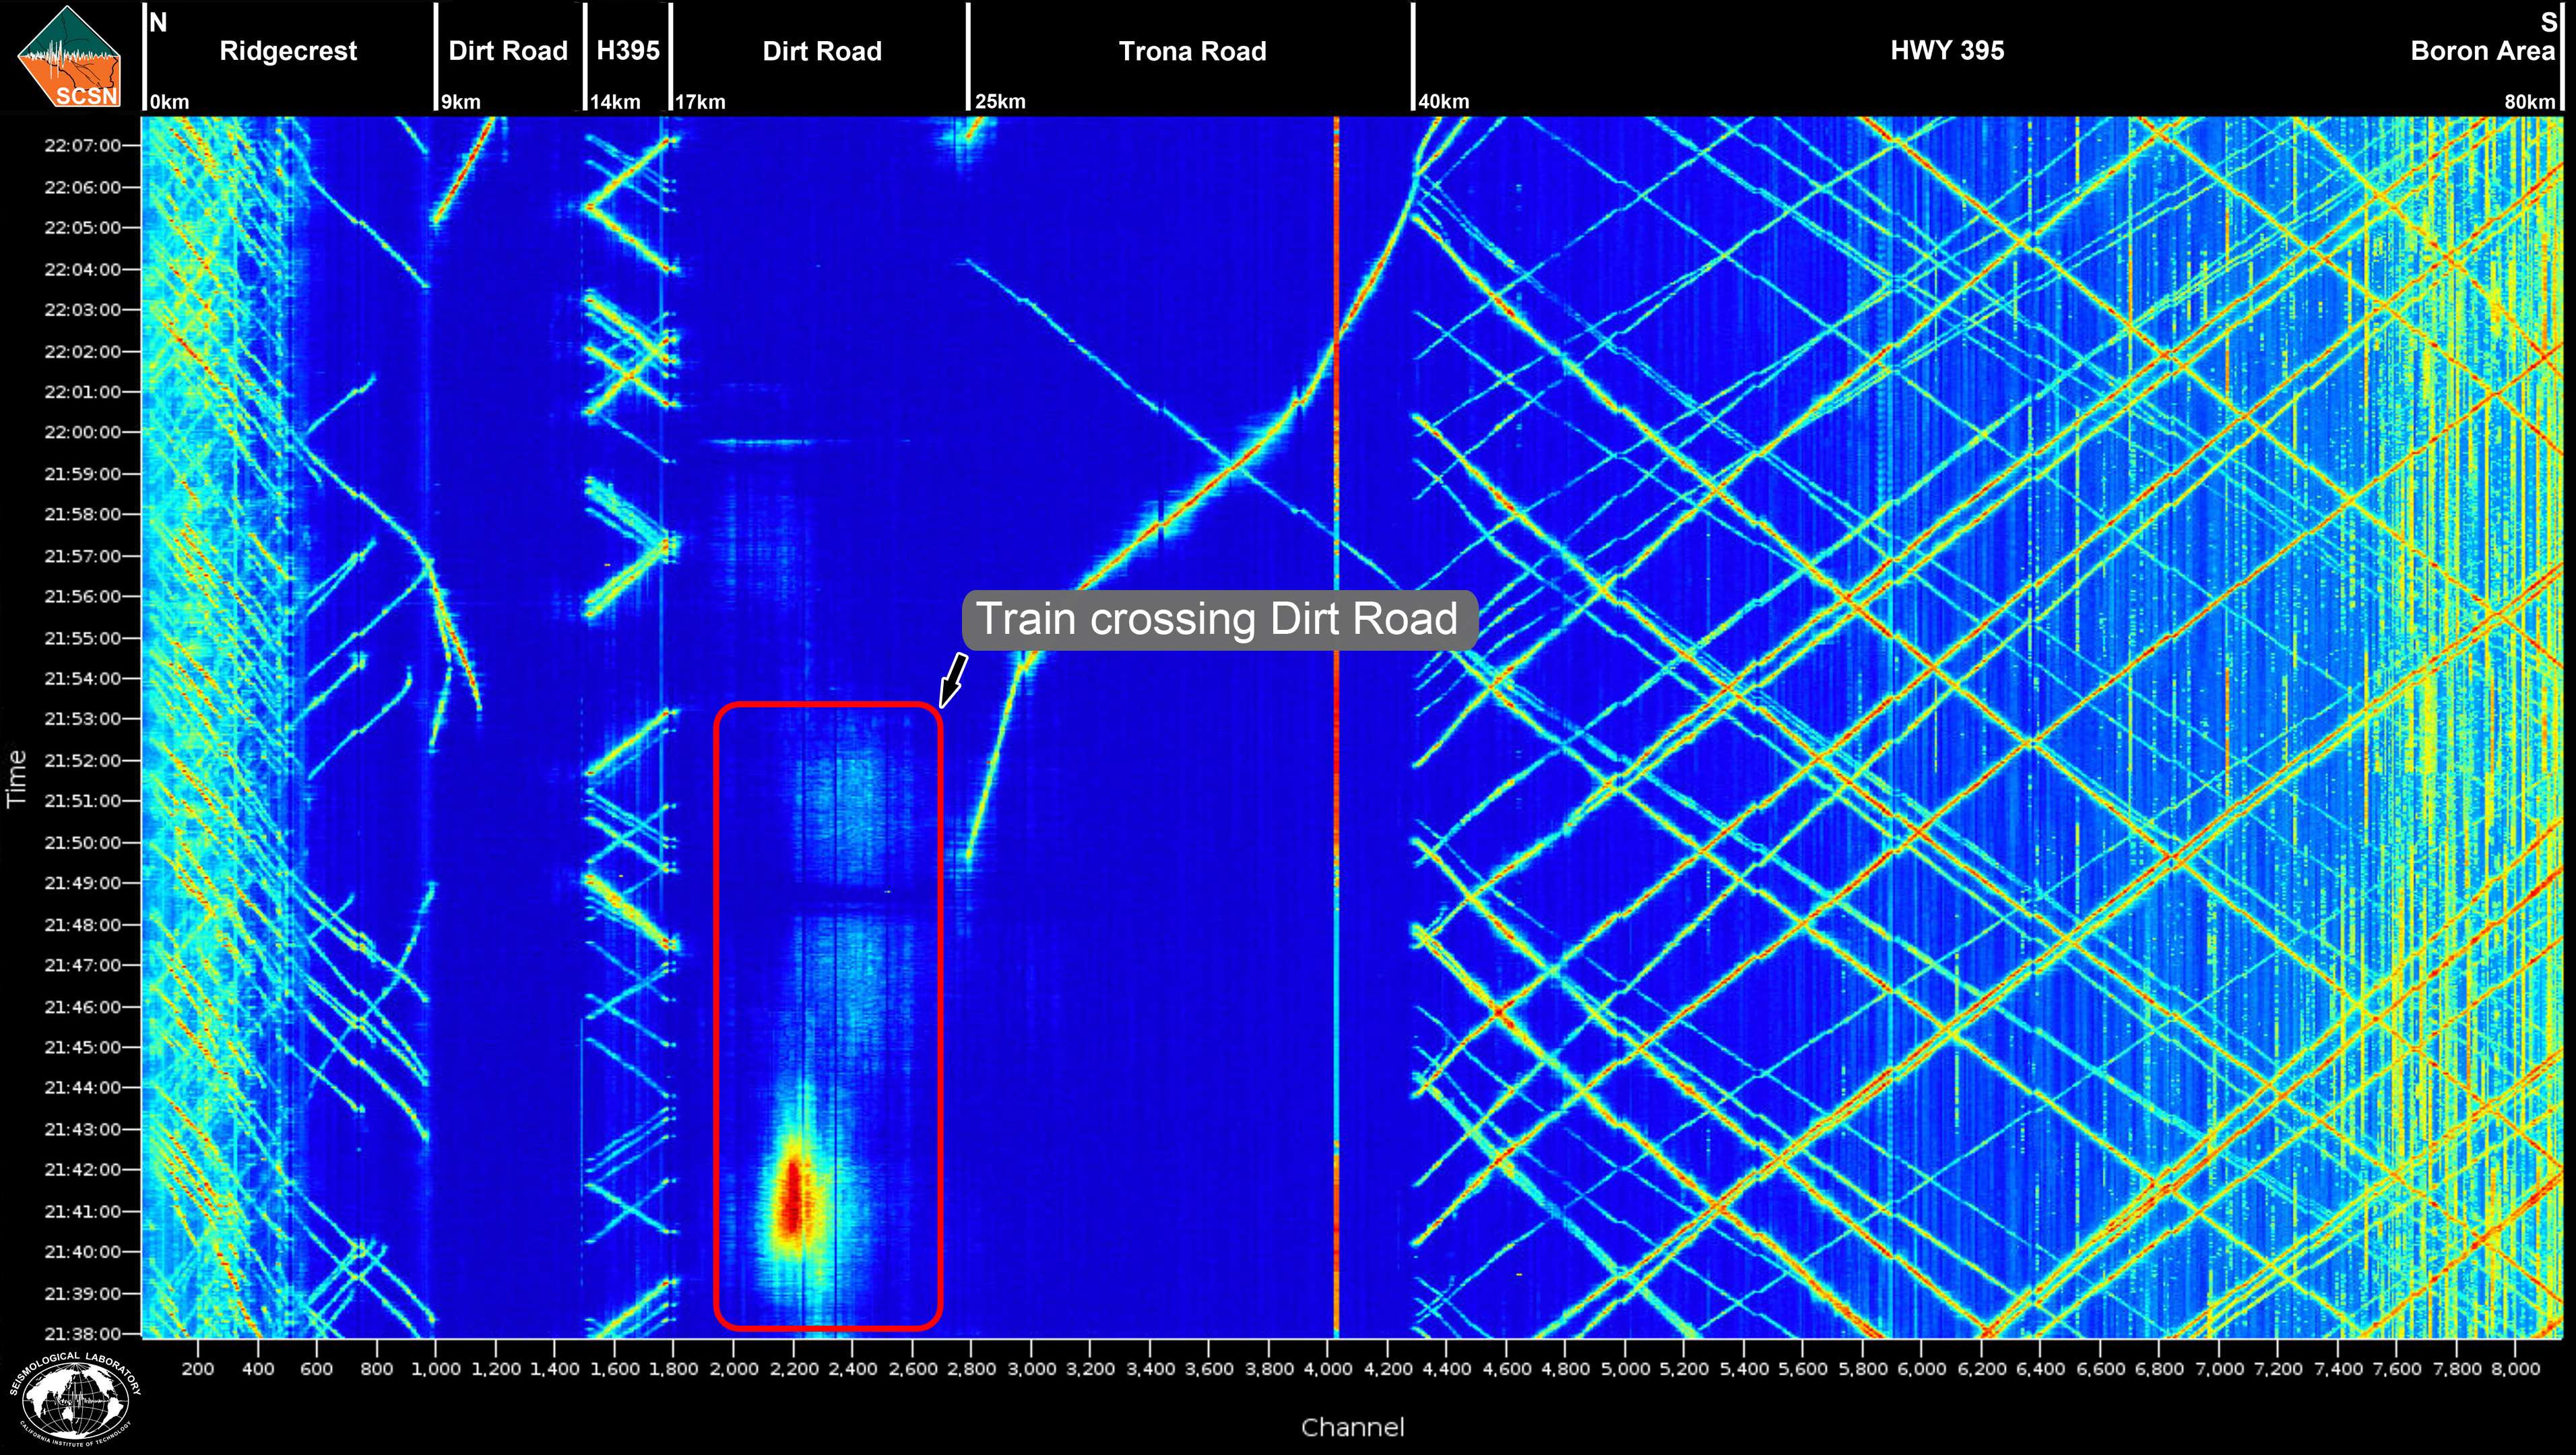
Near channel 2200, train tracks cross the dirt road that the buried cable runs along. Unlike vehicle traffic, the train does not travel along the cable line but crosses nearly perpendicular to it. This leads to only a small number of channels recording all of the shaking generated by a heavy train crossing , which appears as a red ‘blob’ near channel 2200. You can tell by the vertical length of the signal in this image that the train took almost 15 minutes to fully cross the road!
Airplanes
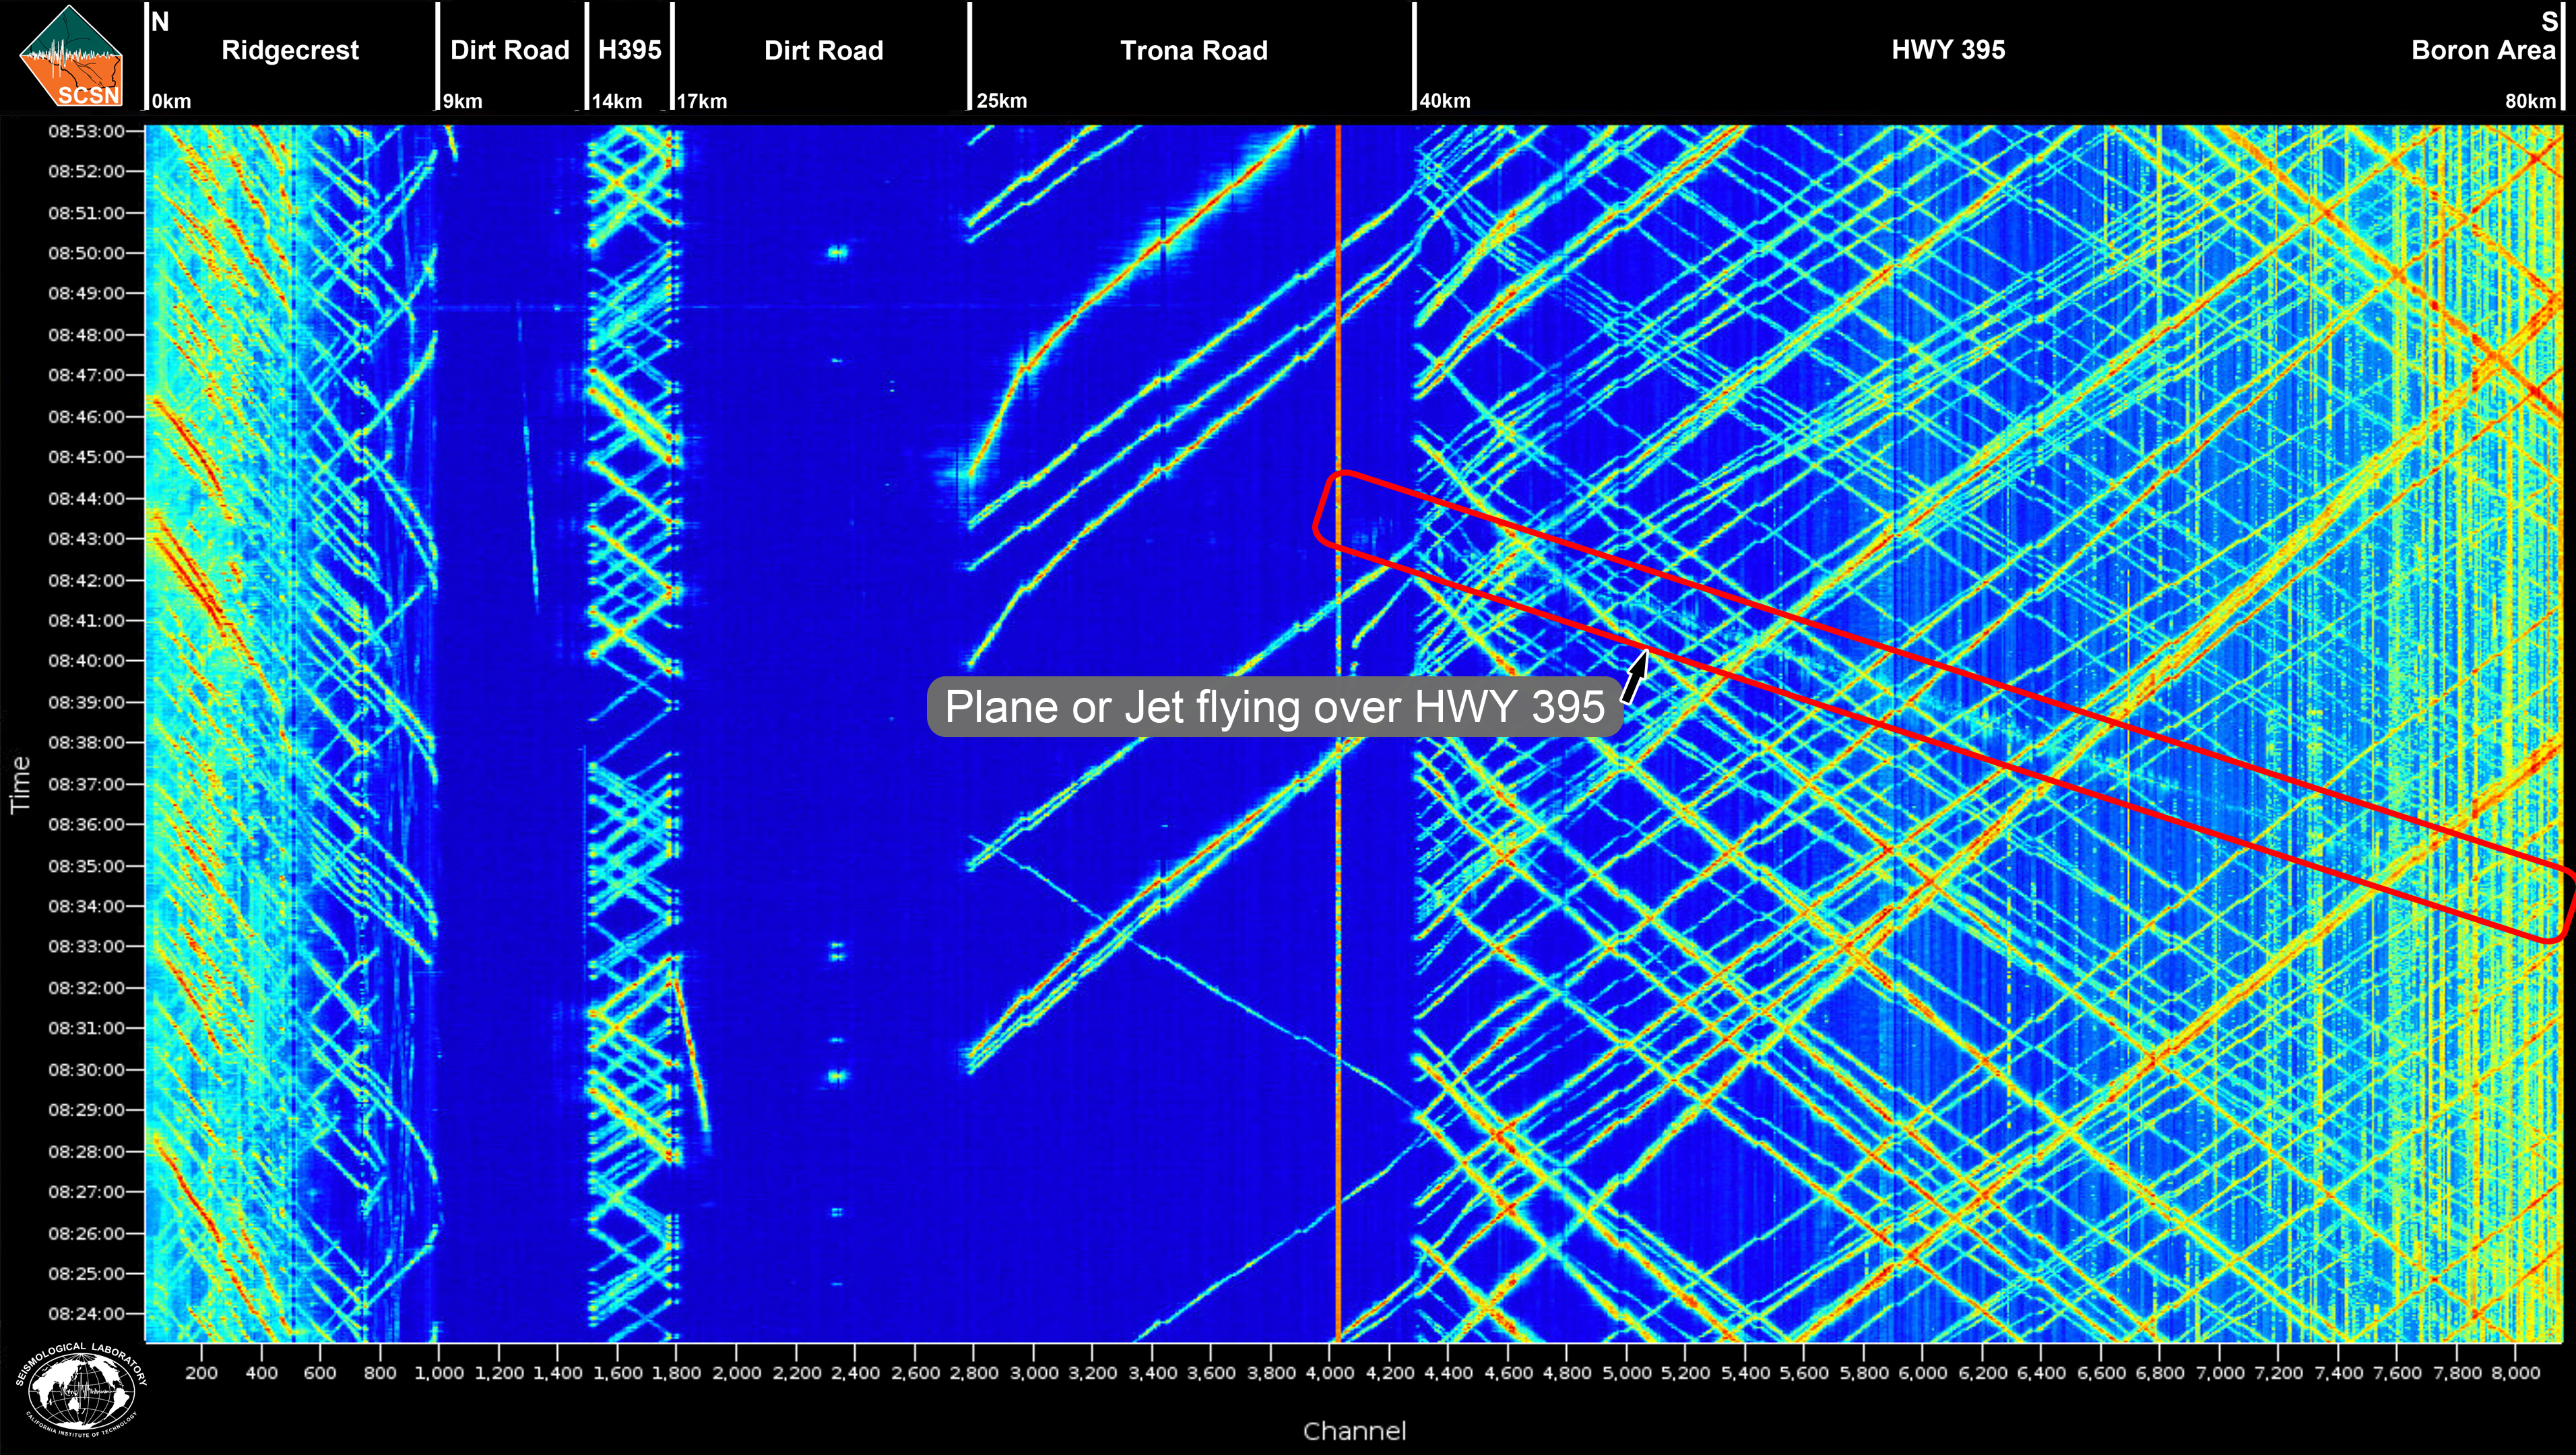
Highway 395 is commonly used as a landmark for military jets and commercial airplanes when flying over the California desert, so it’s not uncommon for there to be air traffic over the area. Though often a bit trickier to spot on the DAS stream due to higher travel speeds, airplane traffic appears as a shallower, lower angle signal (compared to ground traffic) that sometimes travels the full length of the array. Based on the line of the imaged signal, the example here likely shows a private airplane traveling north above highway 395. The signal indicates that it traveled approximately 40 km in about 10 minutes at 240 km/hr.