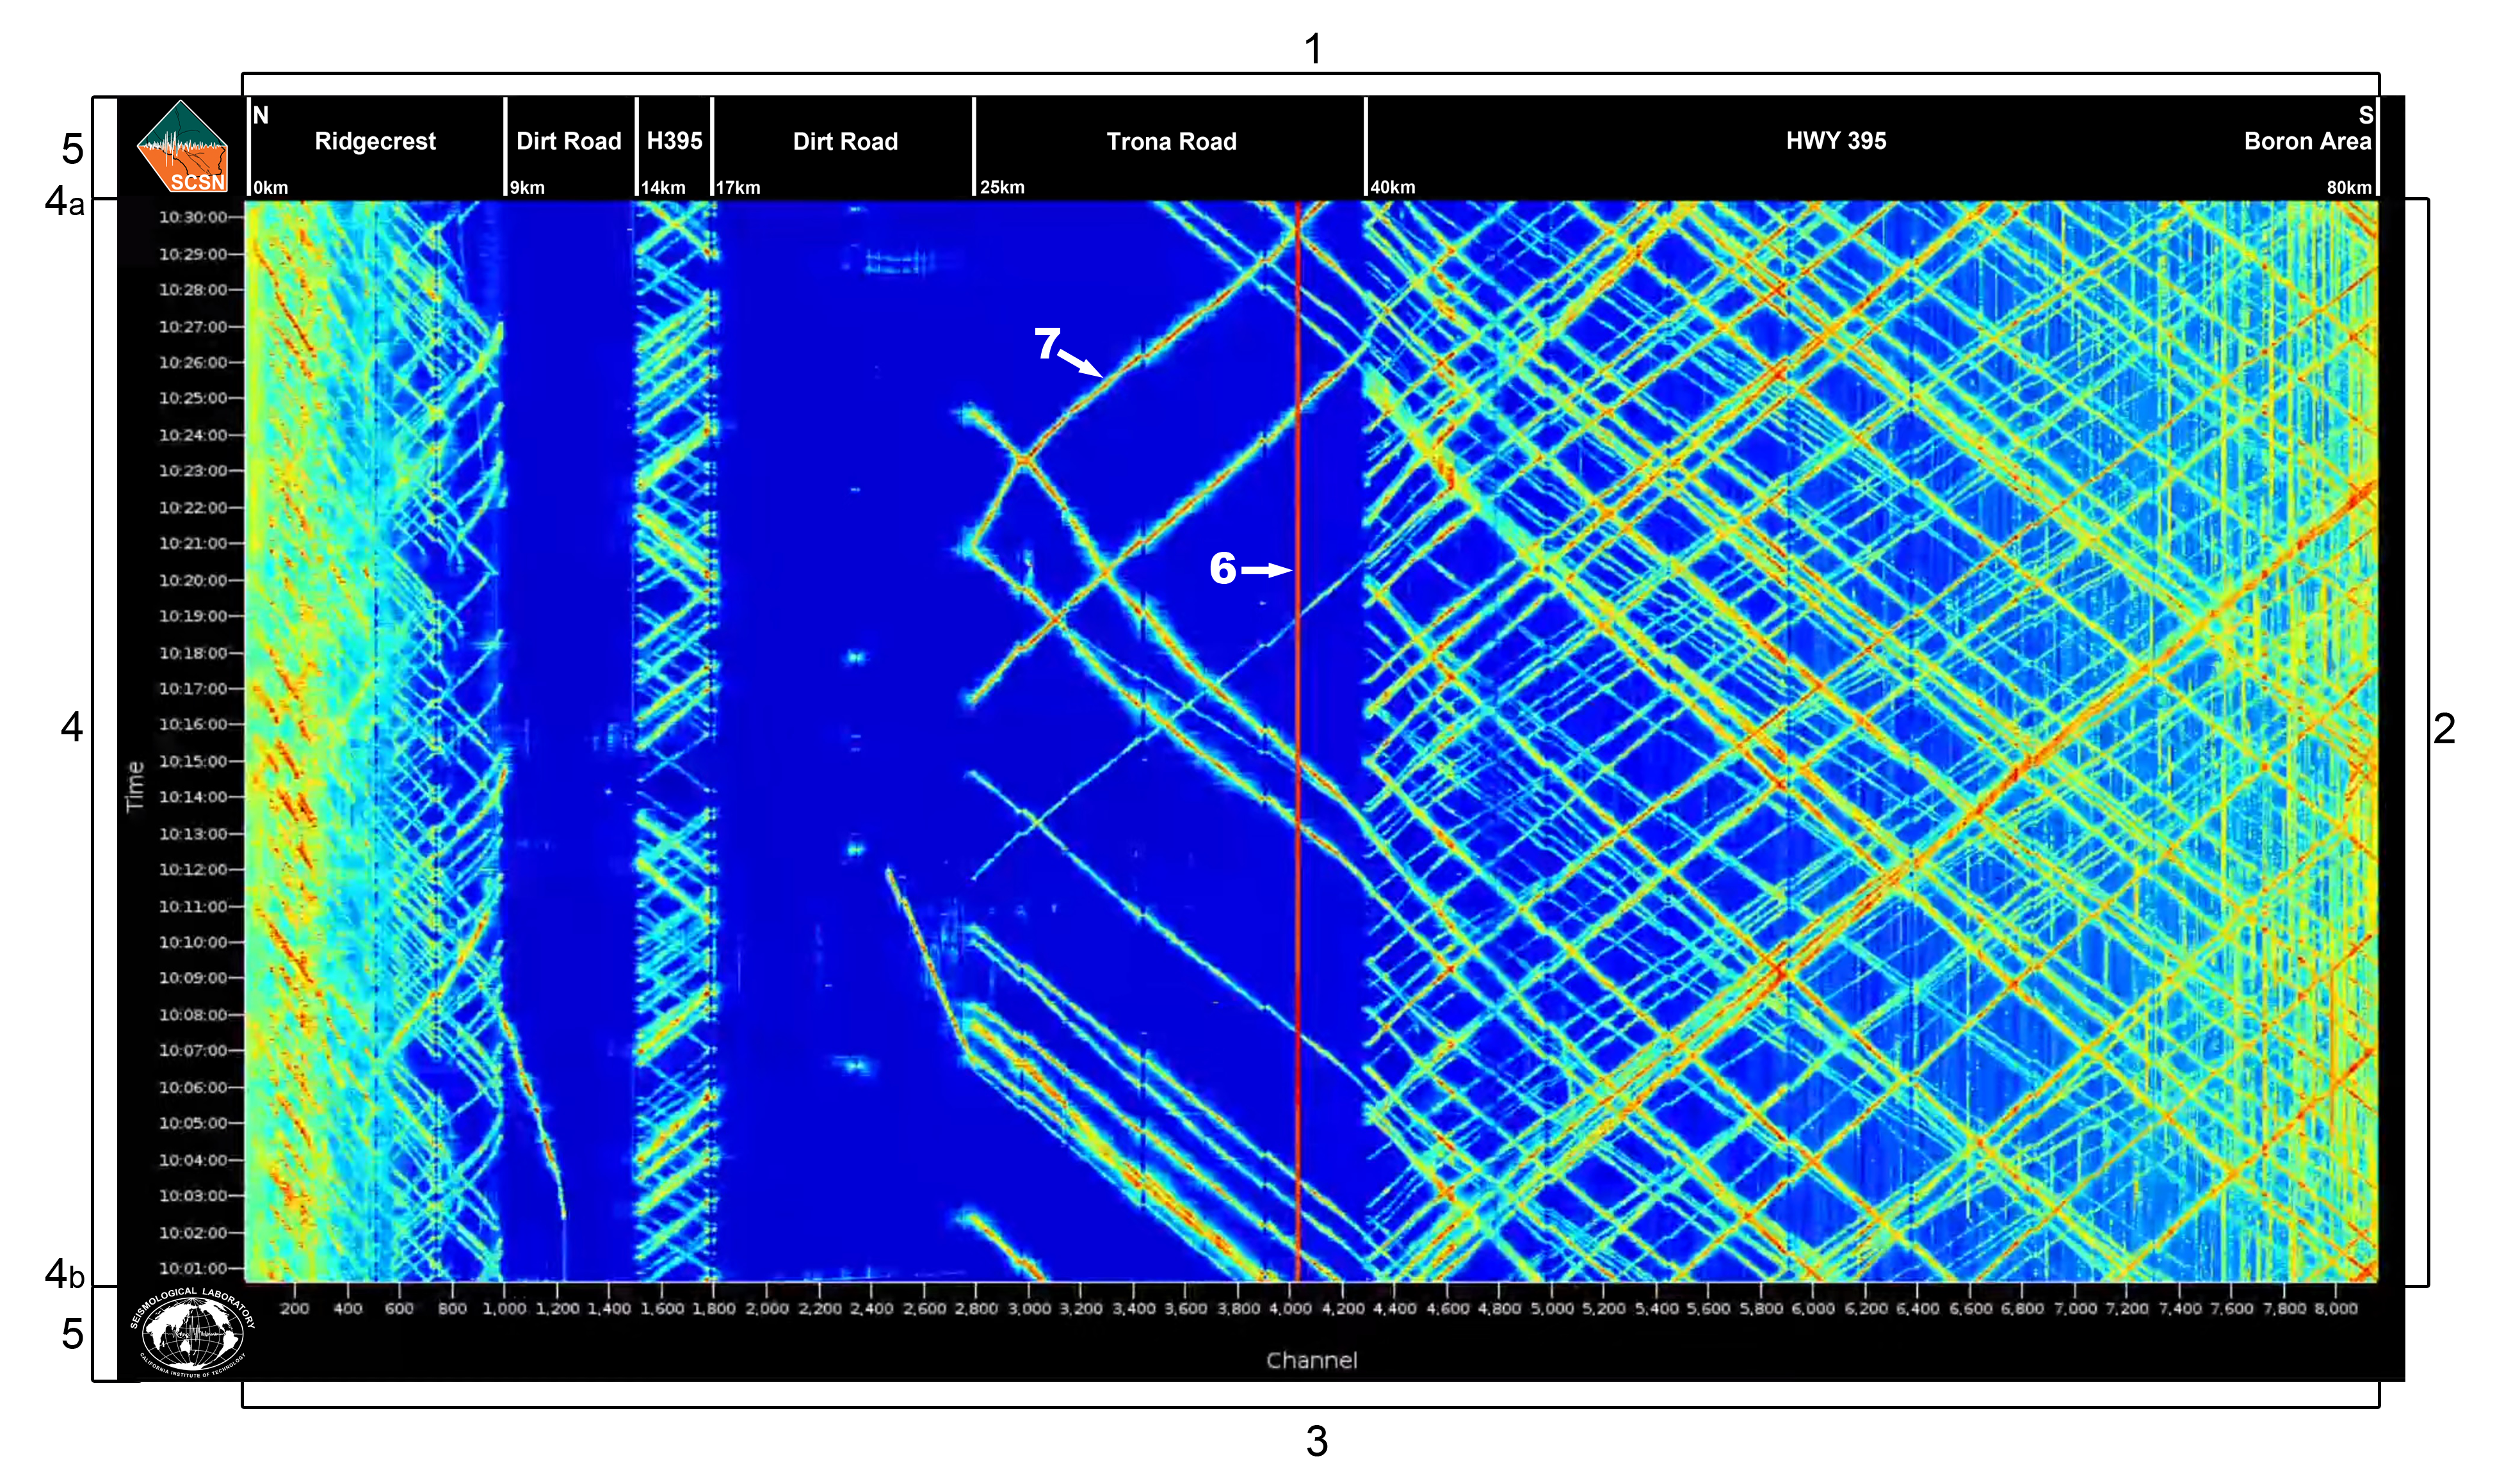
- Geography: The Ridgecrest DAS array utilizes an existing fiber optic cable running approximately north-south from the city of Ridgecrest (left side) generally along Highway 395 towards the city of Boron (right side). Different geographic locations have been labeled based on the average strain on the cable caused by proximity or distance to different shaking sources like cars on the highway and city activity. These labels make what environment the cable is in easily visible and help explain why there may be more or less strain on the cable in the regions with more or less activity. The distances displayed at the bottom of the geography bar indicate the approximate distance from the laser instrument in Ridgecrest to each geographic transition.
- Waterfall Display: Unlike a seismogram which typically streams from left to right through time as single channels, DAS tends to be streamed vertically with the horizontal axis representing the length of the fiber optic cable being utilized and the vertical axis representing the time shown in the window. Colors represent the amount of relative strain on the cable per vertical channel from low strain (little to no shaking, in blue) to high strain (relatively greater shaking, in red).
- Channels: To measure the shaking-induced deformation on a given section of the cable, the length of the cable is divided into a series of channels, about 8200 in our display, that each reflects/scatters laser light back from different distances. The labels along the bottom horizontal axis display the channels grouped by 200 along the length of the cable.
- Time: This image shows 120 minutes of data with point 4a at the top displaying the current real-time measurements and 4b at the bottom showing 120 minutes prior. The time labels actively move from the top of the display to the bottom at the same rate as the data being streamed.
- Logos: Streaming this data is a joint effort between the DAS lab at the Caltech Seismo Lab and the SCSN. With special thanks to Professor Zhongwen Zhan for allowing the use of his instruments to test the inclusion of DAS within our operations; OptaSense, specifically Victor Yartsev, for their constant and continued support of our efforts; and California Broadband Cooperative for access to their fiber network.
- Bad Channel: A section of the fiber optic cable may not be in ideal conditions or may be damaged (for instance, spliced part) at this location, so it cannot be used to record DAS measurements and shows up as a vertical red line.
- Sloped Line: Lines with a slope of roughly 30-45 degrees are the most common geometry visible on this display. These lines are typically produced by vehicles driving along the length of the cable on Highway 395. This specific line angled toward the upper right can be interpreted as a vehicle on the highway traveling south towards Boron. A line sloping to the bottom right on this specific array would be from a car moving north along the road. For more examples of the types of visible events, visit Understanding DAS