Last updated October 4th, 2019
A M4.5 earthquake occurred at 4:49 local time this morning (May 8) under the San Bernardino Mountains, near a complex part of the San Andreas fault. Seismologists call this region the “San Gorgonio knot” because so many small faults intersect here and the main San Andreas trace is not clearly defined.
Historically, this area around Mt. San Gorgonio is the only part of the southern San Andreas fault that produces smaller quakes. Many M3-4 earthquakes have been recorded here. The largest were the M6.0 Desert Hot Springs earthquake in 1948 about 30 miles to the east and the 1986 M5.9 North Palm Springs earthquake that was less than 10 miles east of today’s earthquake.
The focal mechanism calculated by Caltech and the USGS for this earthquake Moment Tensor Page shows the event happened on a fault that strikes a little north of east-west and that the motion was primarily thrust faulting. This means that the north side moved up and over the lower south side of the fault. This is very similar to the motion we saw in the 1986 North Palm Springs earthquake. (https://authors.library.caltech.edu/48710/.)
This morning’s M4.5 was felt from San Diego to Los Angeles. More than 10,000 people have reported feeling it at Did you feel it?. The strongest shaking recorded by the instruments is Intensity VI.
This size earthquake is common in California, happening many times each year somewhere in the state. This is normal activity and has no relationship to the Hawaii eruption.
Technical information about this earthquake and its aftershocks:
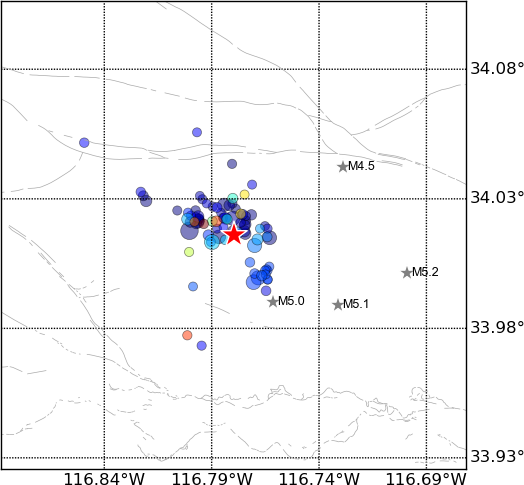
- 08 May 2018 04:49:34 PDT, (34.017, -116.780), depth 12.9km, 11km N of Cabazon, California.
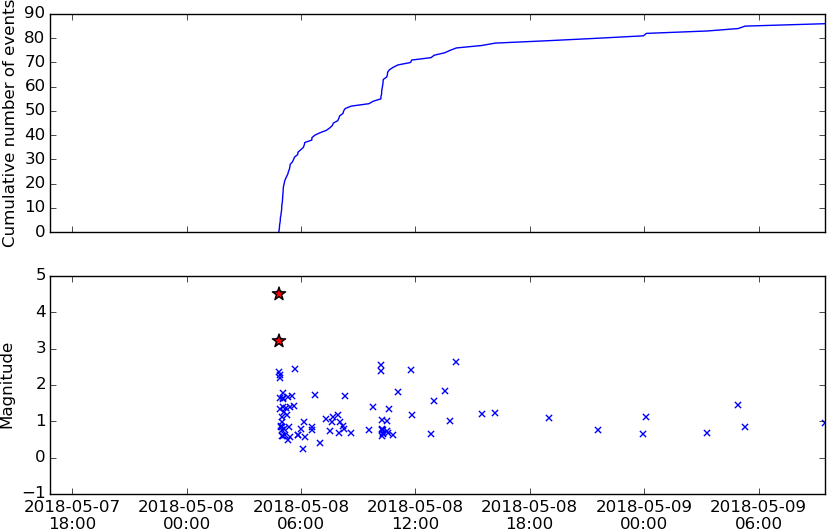
- Aftershocks: so far (09 May 2018, 10:40AM PDT) there have been 88 aftershocks recorded, the largest M3.2 (smallest M0.2). More may be expected in the next few days, the largest expected is approximately 1 magnitude unit smaller than the mainshock. There is a small chance (about 5%) that a larger quake could occur, with the likelihood decreasing over time.
- Historical seismicity: since our records began in 1932 we’ve had 46 events of M4 or greater within 10km of today’s event, the largest was M6.0 (1986/07/08) and the most recent was M4.4 on 06 Jan 2016.
- Nearby faults: San Andreas fault zone, San Bernardino Mountains section (3.0 km).
- Links for: USGS earthquake page, ShakeMap, DYFI, waveforms.
- Visit our special reports page for further information on local notable earthquakes.
Below are the waveform data associated with this event, as recorded in our Live Seismograms Feed.The closest station to the earthquake shown in the view is CI.WWC in Palm Springs at approximately 35km.


