Last updated September 19th, 2018
Update: 24 August 2018
Egill Hauksson, Zach Ross and Jen Andrews, Caltech; Elizabeth Cochran, USGS Pasadena
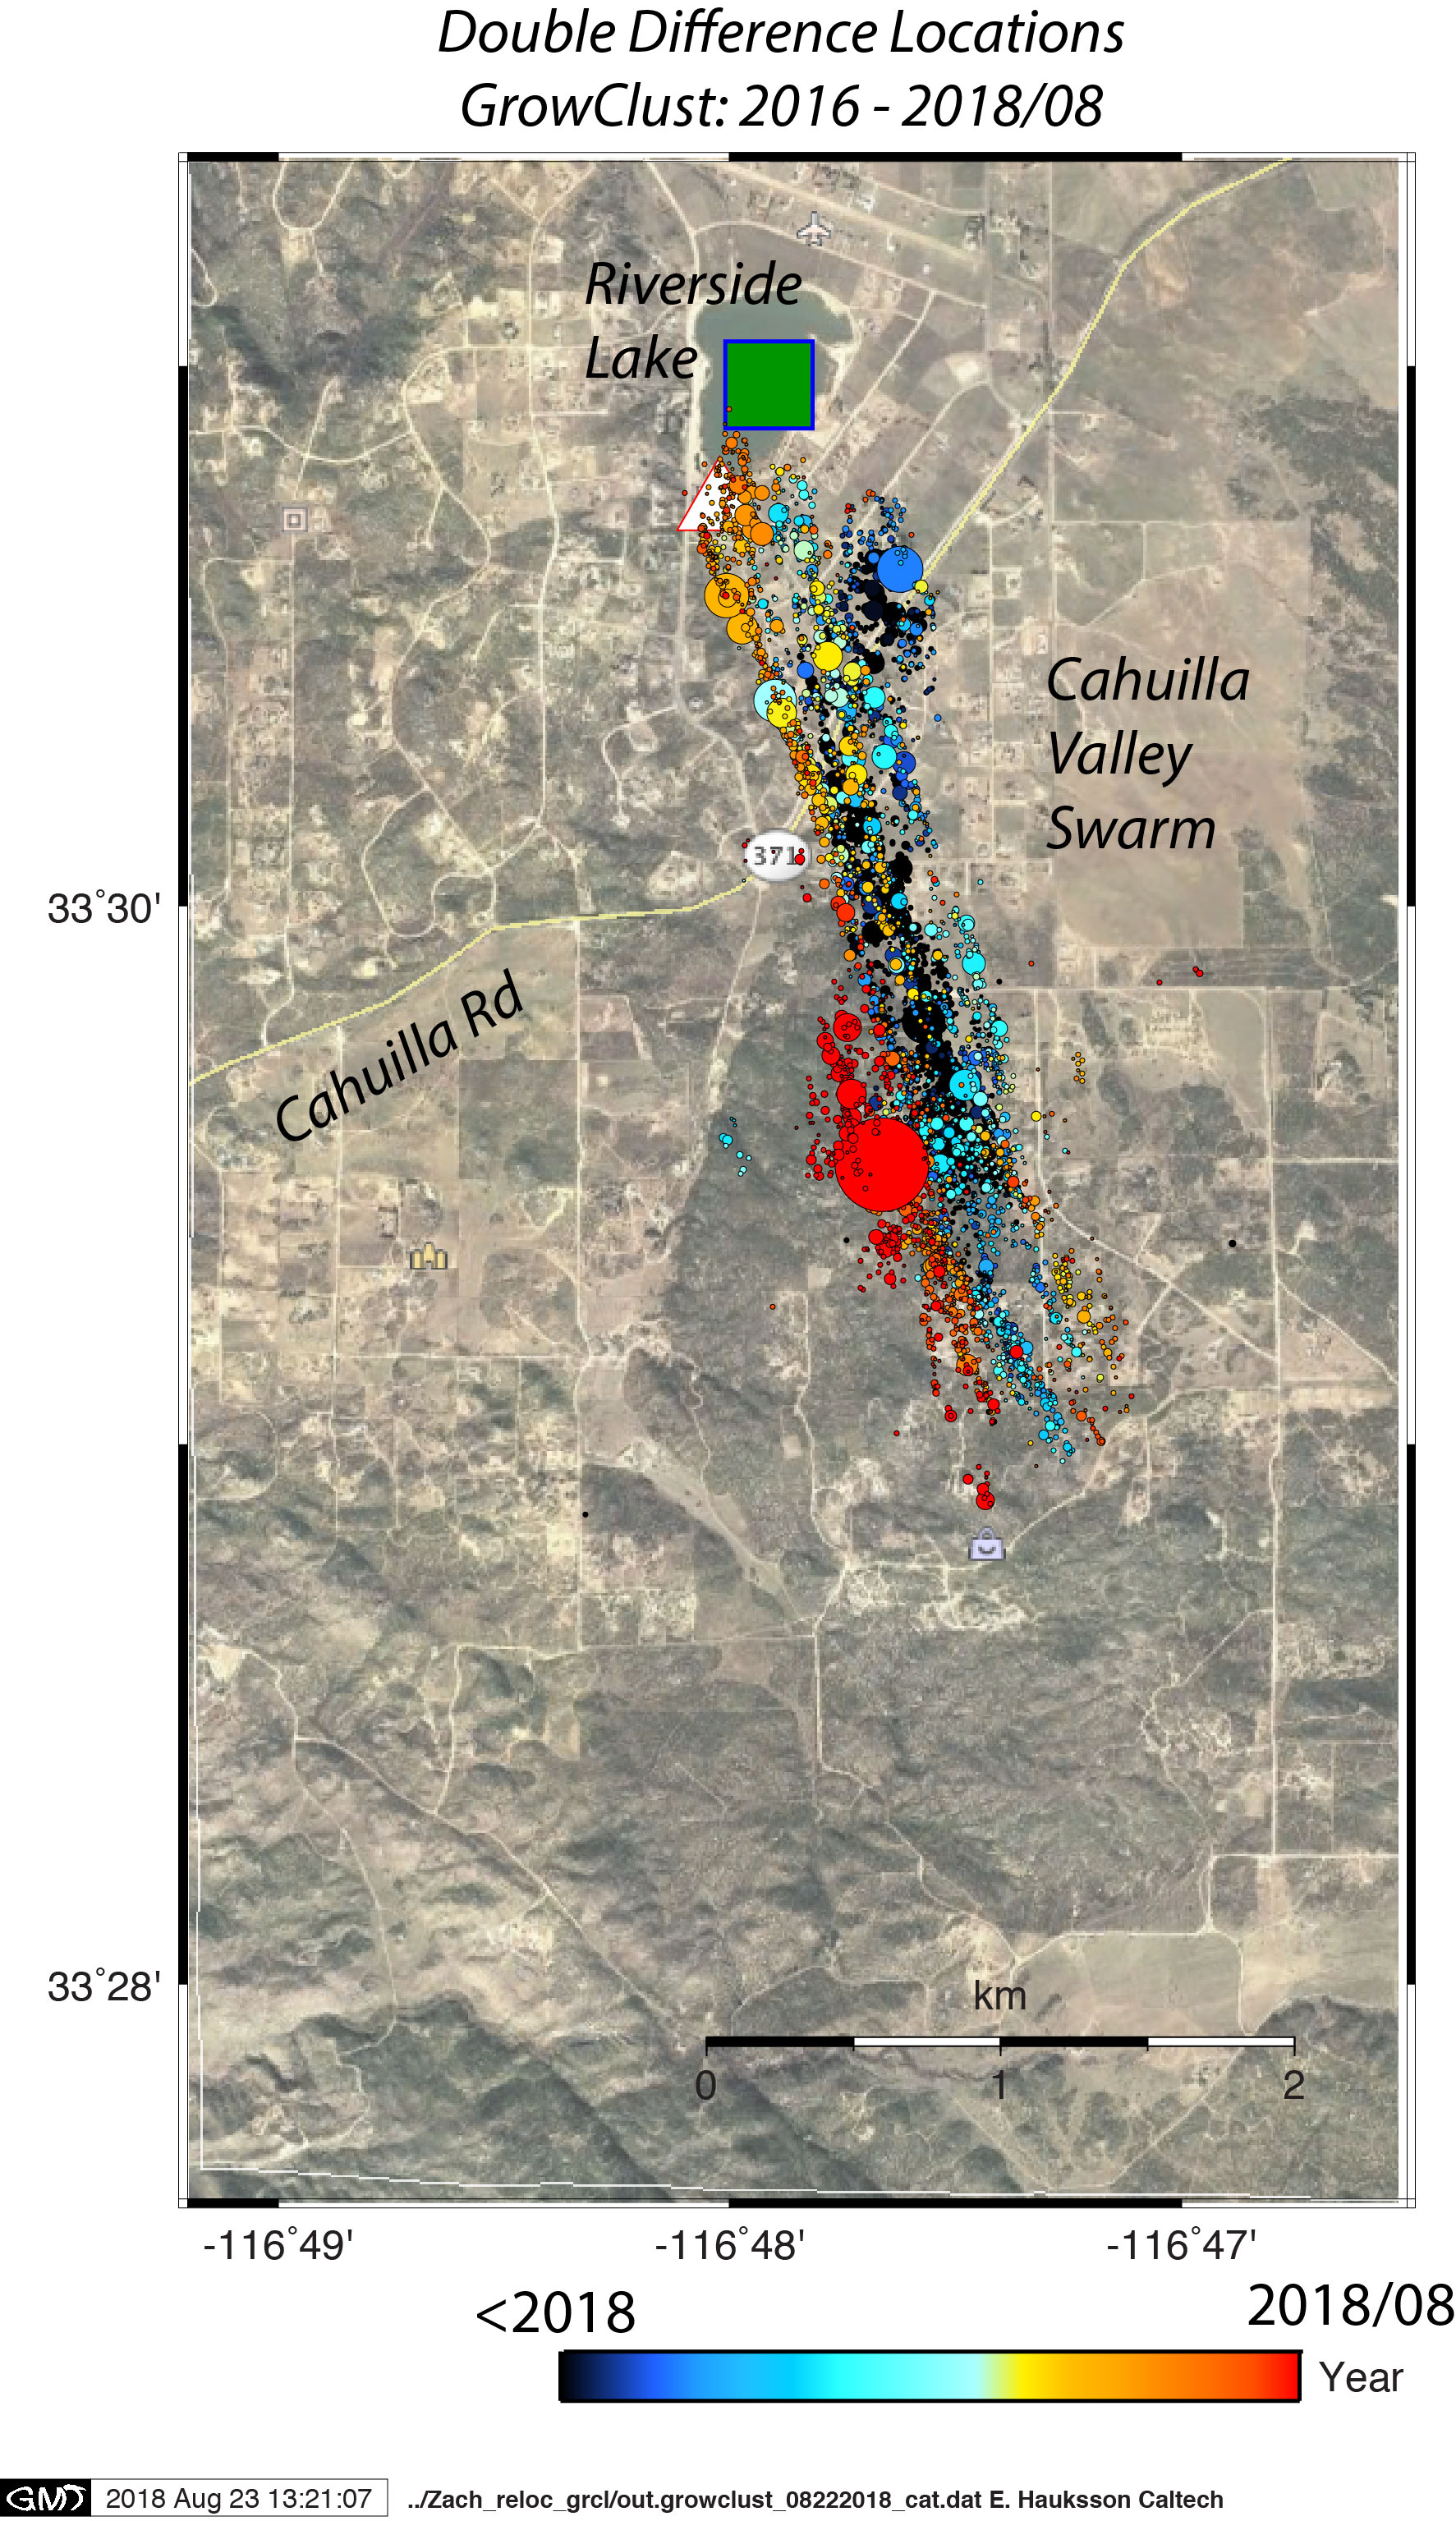
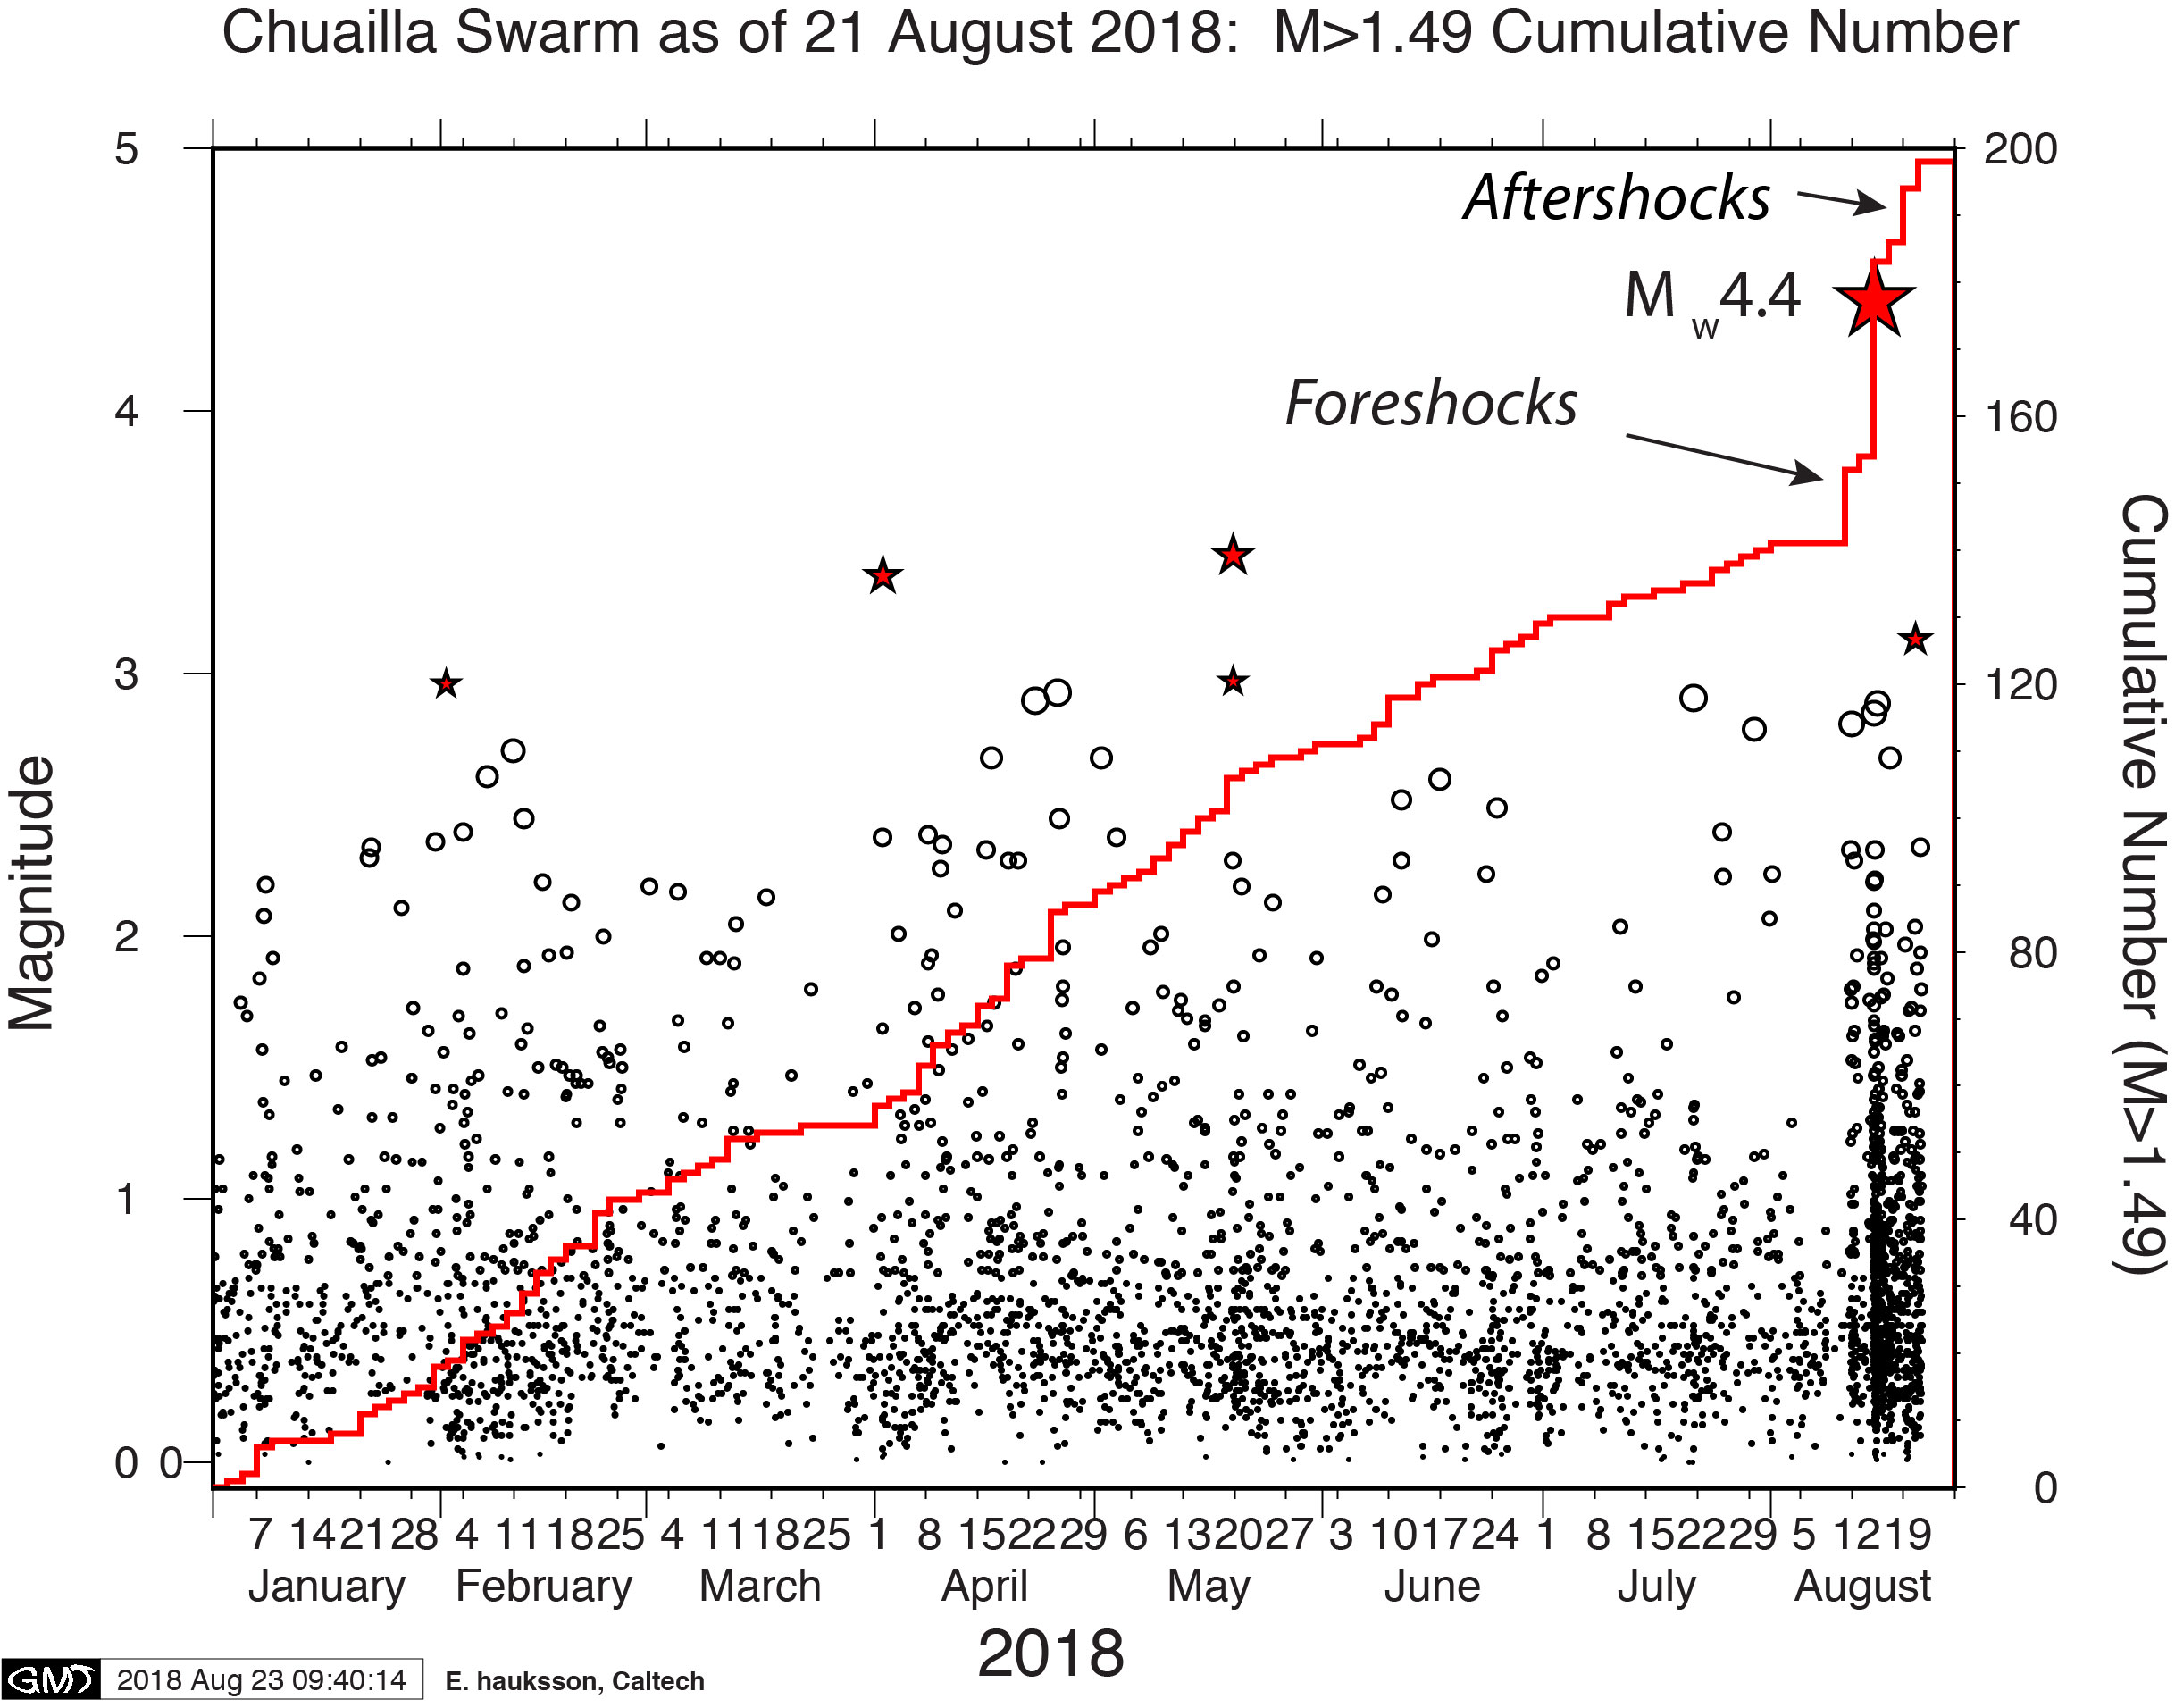
The most recent Cahuilla swarm, which started in mid-2016, has grown steadily in number of events (currently ~6,300 of magnitude larger than 0.3) and presently extends over an almost north-south linear trend of about 7 km. Since late on 11 August 2018 the seismicity accelerated with a 120-event foreshock sequence, which culminated with a mainshock of Mw4.4 on 15 August 2018. The mainshock was followed by more than 200 aftershocks of magnitude larger than 0.3 over a period of 12 hours. This new activity extends the spatial distribution of the sequence about 0.5 km to the southwest. The b-value decreased from ~0.94 to ~0.74 during this most recent activity, suggesting that a new region, possibly of higher state of stress, was being activated.
This is a fascinating sequence from a scientific point of view but it has almost no immediate hazards implications. It could end up with a M5 event, but a much bigger event is very unlikely.
The observations that we have so far are:
- The sequence started back in June 2016 with small events of magnitude 0.5 to 1.5.
- Since June 2016, we have recorded about 6,300 events of magnitude larger than 0.3, and the largest M4.4 occurred 15th August 2018. This is a great area to record small events because there is little traffic noise and the rocks are very solid.
- These events are shallow, or 4.5 to 5.5 km deep; but large events on major faults usually start twice or three times as deep.
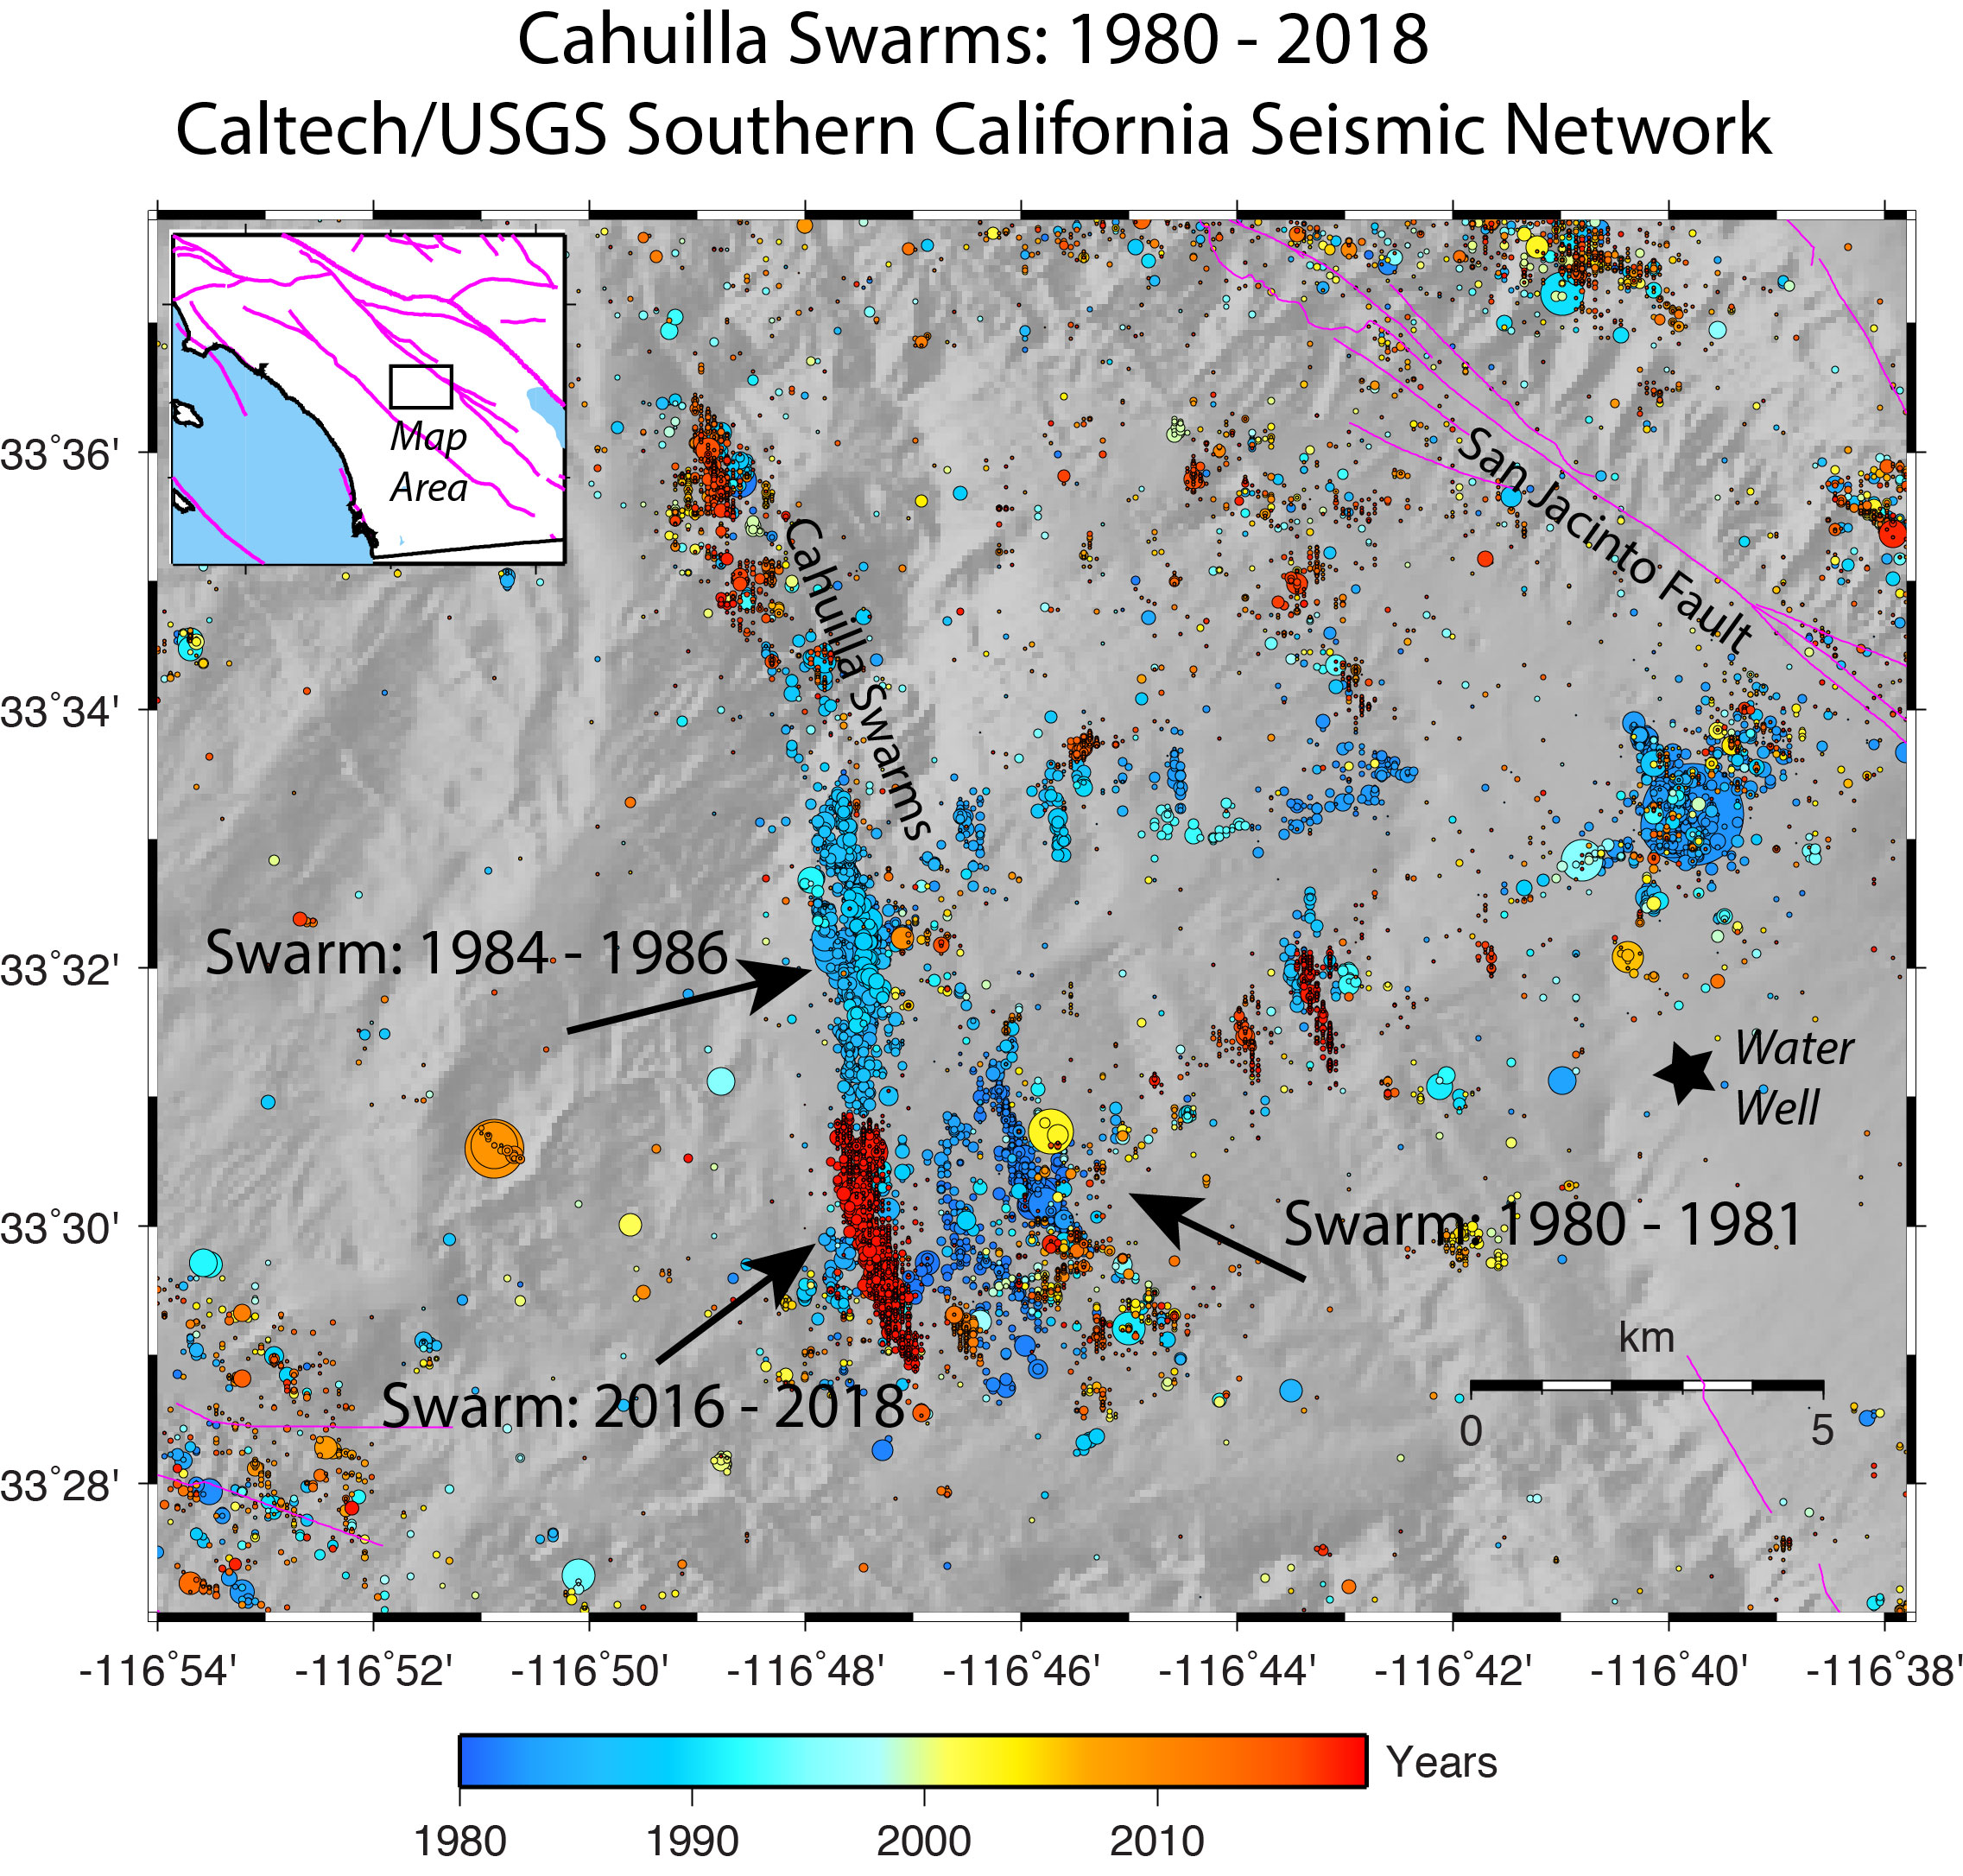
- This activity is not on a major fault but half way between the Elsinore and San Jacinto faults. No major events have occurred here in the past, if it had there would be a fault scarp.
- We are not sure what is causing these events. We have looked for fluid injection or extraction but we did not find any evidence. The rocks in the area are solid and it is almost impossible to inject water into them. The likely cause is low tectonic strain from the loading of the San Jacinto or Elsinore faults, which is being absorbed by ancient (maybe as old as 50 million years) geological cracks in the rock.
- Two similar earthquakes swarms like this one that occurred in the area in 1980-1981 and 1983-1984 were not followed by bigger events on other faults. The map below shows the time/space evolution of all three swarms. Note the small north-south spatial extent of ~5km for the 2016-2018 swarm. In comparison, the 1992 M7.3 Landers quake extended about 100 km north-south.
- Will the activity continue? Yes, but the region is now in an aftershock mode following the M4.4, which means decreasing activity over time. However, there seems to be small (approx. 0.5 km) spatial migration to the southwest, which could cause renewed activity. This would be a new chapter in a still to be completed saga. The plot below shows activity since 1 Jan 2018 to present as magnitude versus date. The red stair-stepping line is the cumulative count of events larger than M1.5, which shows that the rate of events is pretty steady indicating that this sequence is continuing.