Last updated October 4th, 2019
We are actively updating this post with information…
Summary
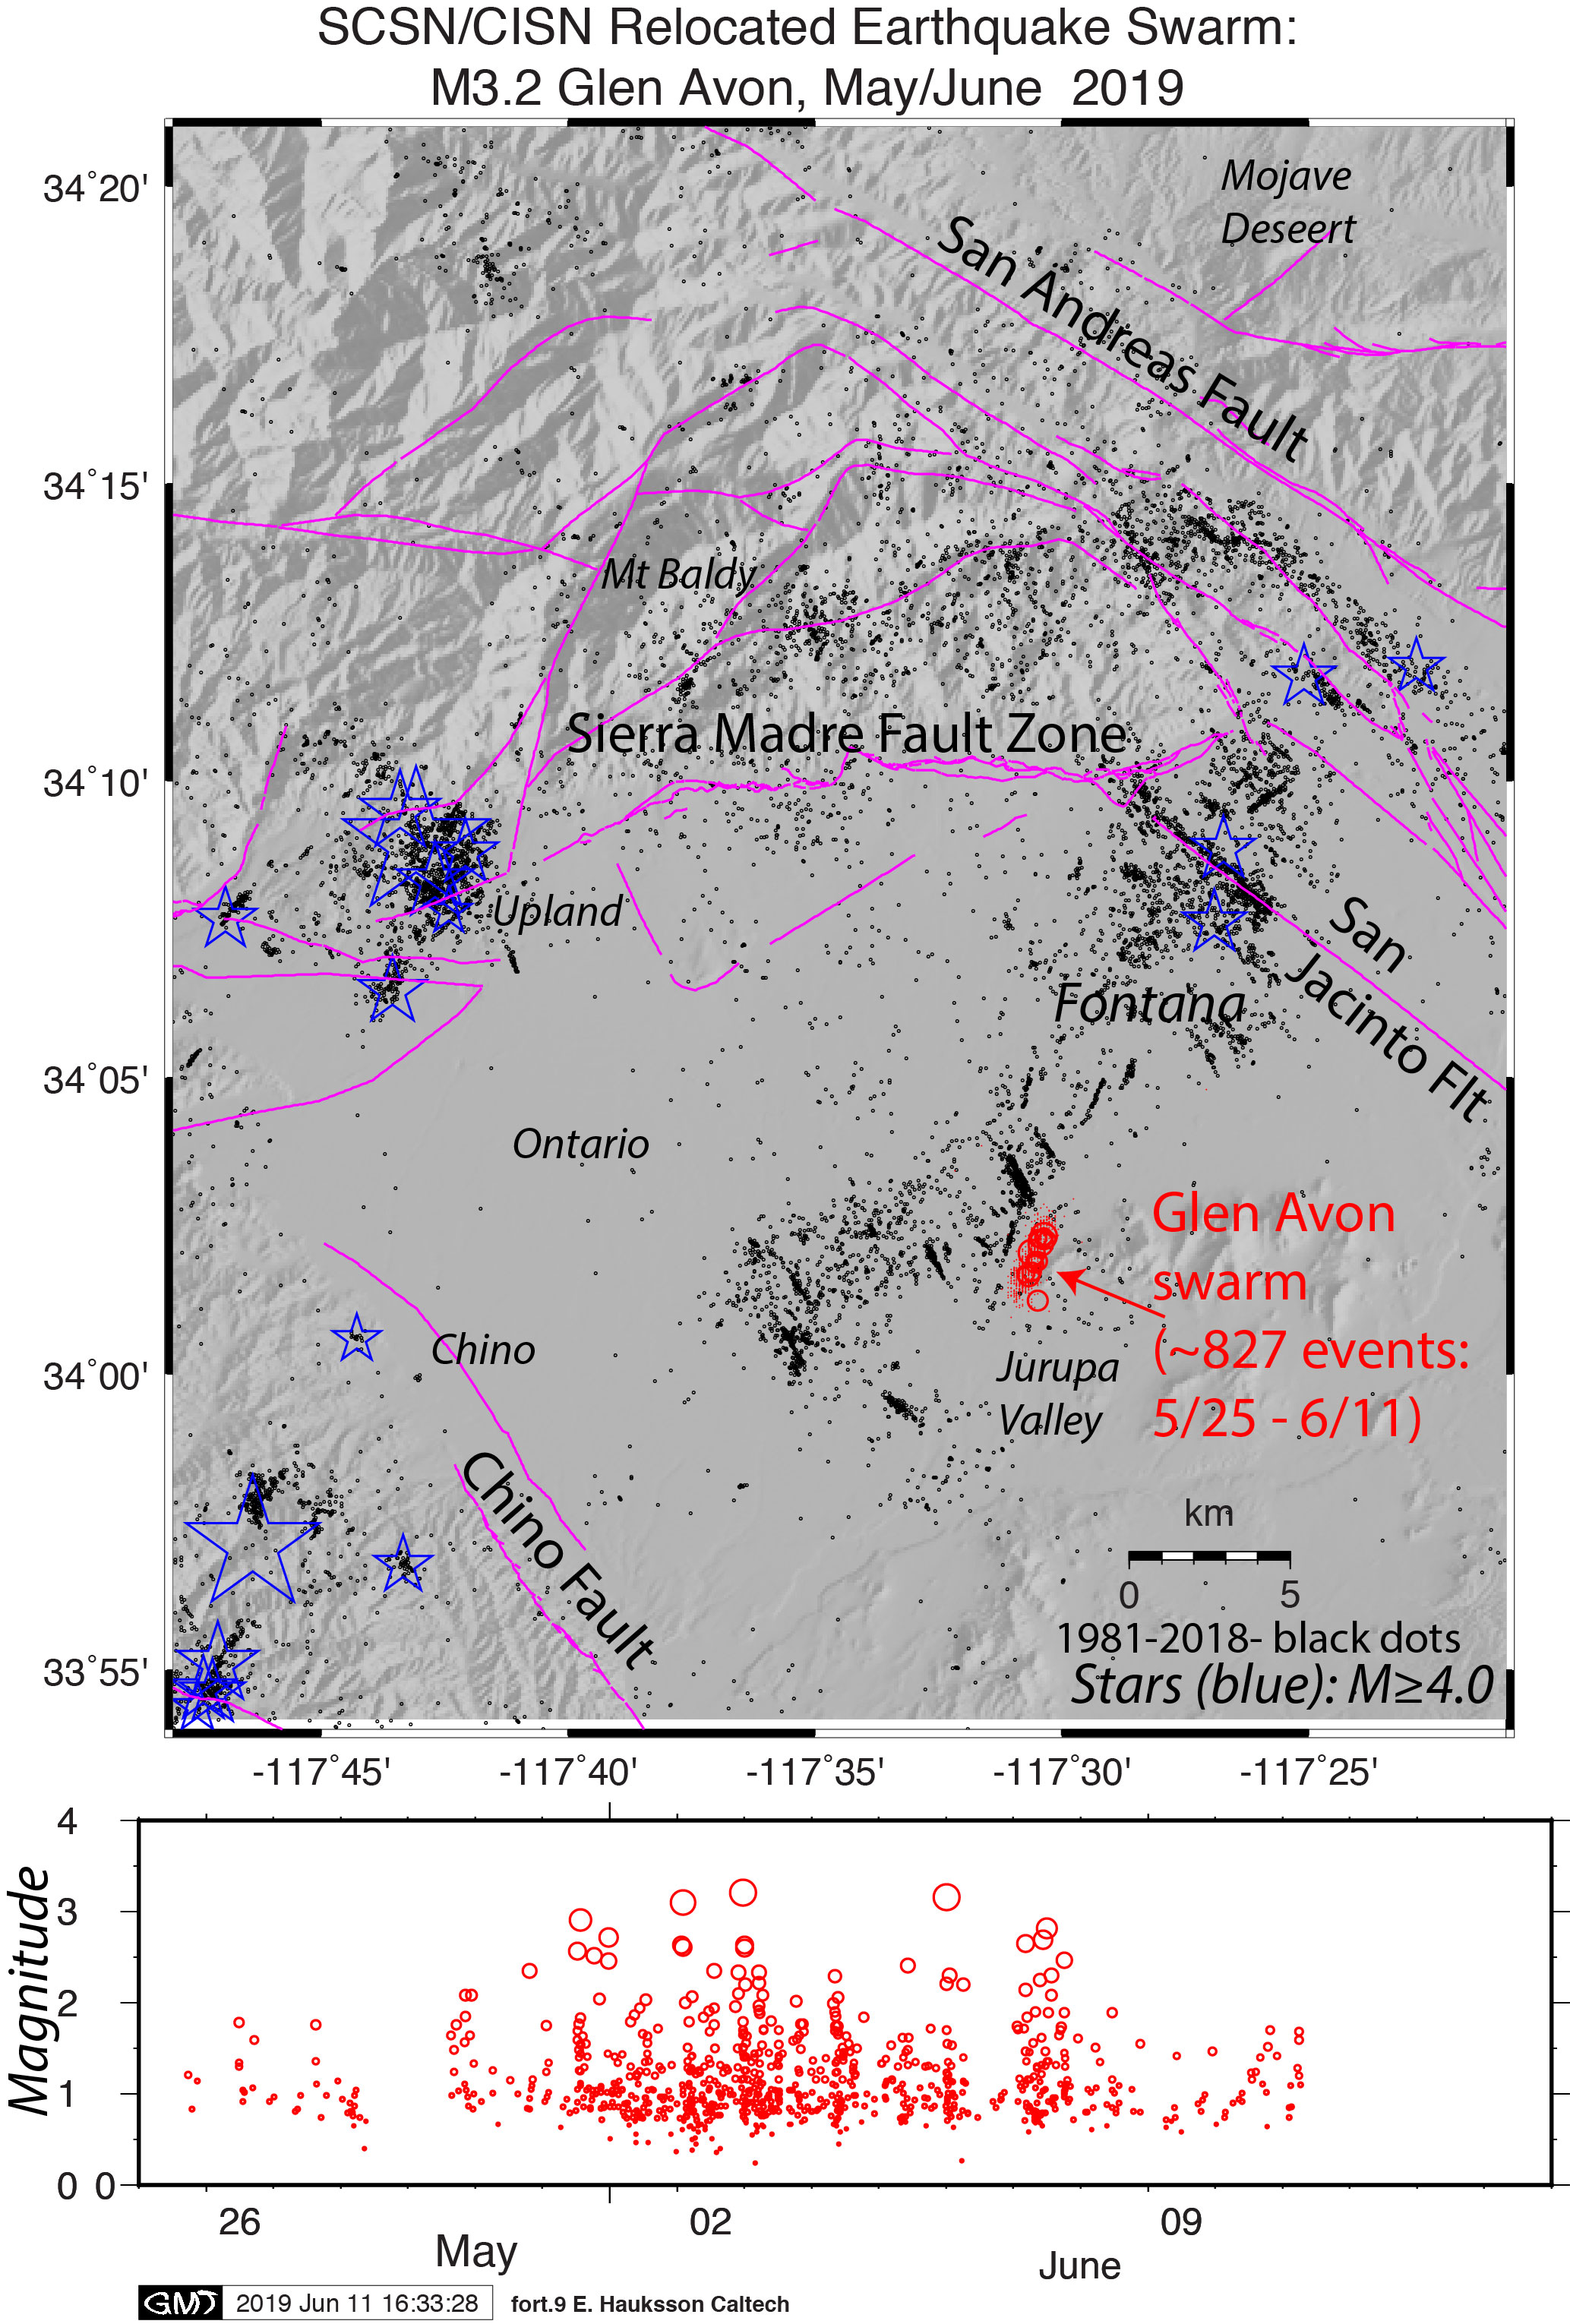
Swarms of small magnitude events are relatively common in this area, extending from Riverside to Chino. Based on past historic recordings this swarm is only expected to generate events of magnitude less than 4.0. The swarm falls within the northeast trending Fontana Seismicity Trend, which has no major mapped fault but relatively abundant small seismicity indicating a local network of small fractures and faults. Earthquakes in this area are probably related to the tectonic loading of the nearby San Jacinto and San Andreas faults.
Events
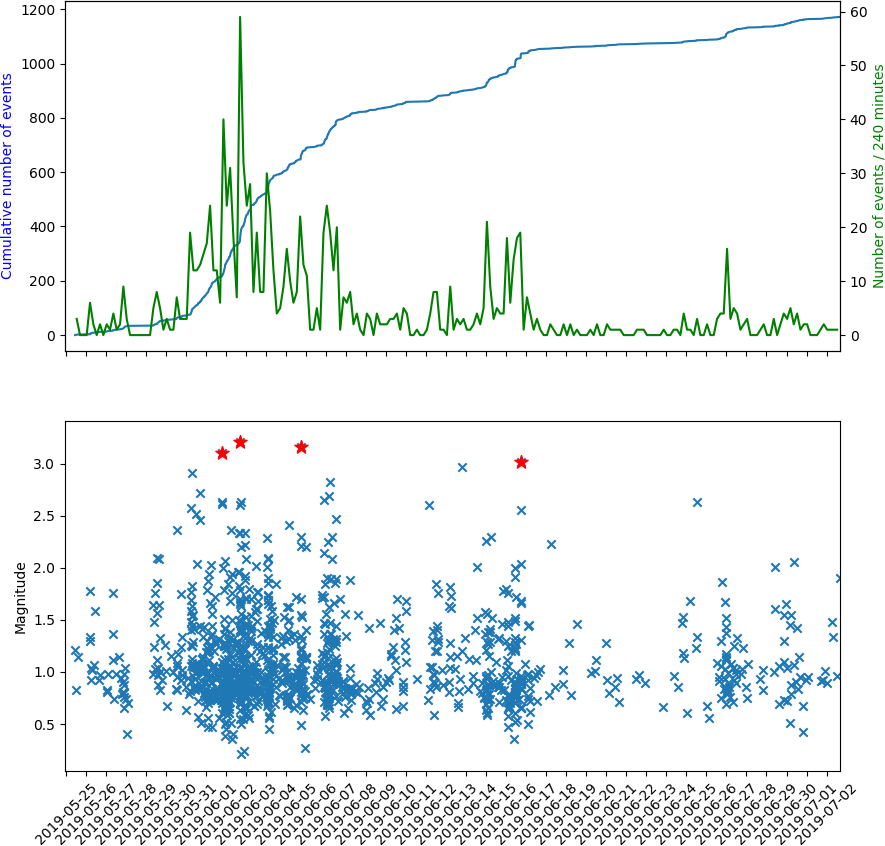
- Current swarm started 2019/05/25 and SCSN has recorded over 1,180 events so far (2019/07/02 4:30pm).
- Largest event so far: M3.2, 02 Jun 2019 16:36:36 PDT, 5km NNW of Glen Avon, California (34.053, -117.500), depth 2.5km.
- Number of events M2-M3: 53 (as of 2019/07/02 4:30pm)
- Number of events M≥3: 5 (as of 2019/07/02 4:30pm)
- M3.1 01 Jun 2019 19:19:48 PDT
- M3.2 02 Jun 2019 16:36:36 PDT
- M3.2 05 Jun 2019 17:20:57 PDT
- M3.0 13 Jun 2019 19:16:07 PDT
- M3.0 16 Jun 2019 17:12:01 PDT
- Events are relatively shallow for southern California, contributing to several of them being felt.
- Earthquake swarms are characterised as clusters of events in space and time that have no obvious mainshock. See this page for further information on southern California swarms.
Historical Seismicity
- Previous swarms in this area: swarms in this area have been recorded back through the 1980s, when our instrumentation network became sensitive enough to detect these smaller events. Swarms containing fewer events (between 50 and 100) were recorded in February and March 2019 along the same fracture, slightly to the NE.
- Since our records began in 1932 we’ve had 18 events of M4 or greater within 10km of today’s event. Most of these events above M4 lie on or near the major adjacent faults: the San Jacinto and San Andreas.
Faults
- CFM fault associations: most likely Fontana Seismicity lineament (89.9%). Alternates: Not associated with a CFM modeled fault (10.1%).*
- Nearby faults: Red Hill-Etiwanda Avenue fault (10.7 km), Red Hill-Etiwanda Avenue fault (Etiwanda Avenue fault) (10.9 km), Sierra Madre fault zone, Cucamonga section (Cucamonga fault) (11.9 km) and San Jacinto fault zone, San Bernardino section (San Jacinto fault) (15.4 km).**
Additional Information
- Links for: USGS earthquake page, ShakeMap, DYFI, waveforms.
- Visit our special reports page for further information on local notable earthquakes.
Below is a video depicting the emergence of the 2019 Glen Avon earthquake swarm through time from May 19, 2019 through to June 6, 2019. Markers are scaled to depict relative magnitude.
Click on Glen Avon KMZ to download the .kmz and run this visualization yourself in Google Earth. (Unzip the file and drag/import it into an open Google Earth window.) Earthquakes included are scaled based on magnitude and are clickable to display a tooltip with the date, magnitude, location, and depth of each earthquake. The data displayed can be acquired at scedc.caltech.edu.
Below are the waveform data associated with this swarm, as recorded in our Live Seismograms Feed for events of magnitude 3.0 and higher. Note that for some of the events, small foreshocks can be seen shortly before the main events listed in the title.
*Earthquakes can occur both near or on major known faults, and in places where no clear fault zones are known. Using the statistical method of Evans et al. (in prep. 2019) the location and focal mechanism of this earthquake suggest the above association with modeled faults in the Community Fault Model (CFM) provided by the Southern California Earthquake Center (SCEC) and Harvard University. Note that the CFM fault association may be different from the nearby faults list. Differences may arise due to different fault databases, and because the CFM fault association uses the hypocenter with relation to subsurface 3-dimensional fault orientation models, while the nearby faults list utilizes mapped surface traces as they relate to the epicenter.
CFM Fault: SCEC CFM 5.0 Fault name and closest segment if available; The CFM is maintained by Harvard University, Dept of Earth & Planetary Sciences.
Probability: The probability in percent the earthquake is associated with this fault.
SCSN: Caltech/USGS Southern California Seismic Network
**U.S. Geological Survey and California Geological Survey, 2006, Quaternary fault and fold database for the United States, accessed 2015, from USGS web site: https://earthquake.usgs.gov/hazards/qfaults/
This information is subject to change as more up-to-date data become available.


