Last updated October 4th, 2019
Please note that this sequence has been renamed, earlier reports used ‘Searles Valley Sequence’.
The Ridgecrest Sequence started on July 4th, 2019 and so far has included one strong (M6.4, 2019/07/04) and one major (M7.1 2019/07/05) earthquake. The closest large population center is the city of Ridgecrest with a population of 28k people. Maximum shaking levels are estimated to be MMI IX (Violent) in the epicentral region and very strong shaking (MMI VII) occurred over a 40 km wide region near the epicenter that includes the city of Ridgecrest. Shaking was widely felt throughout California, including light to moderate ground shaking in Los Angeles, weak shaking in the San Francisco Bay Area, and felt shaking extending at least as far east as Phoenix and as far north as Sacramento.
Largest Events
- 04 Jul 2019 10:33:48 PDT, (35.705, -117.508), depth 8.7km, 12km SW of Searles Valley, California
- 05 Jul 2019 20:19:52 PDT, (35.766, -117.605), depth 10km, 17km NNE of Ridgecrest, California
Aftershocks
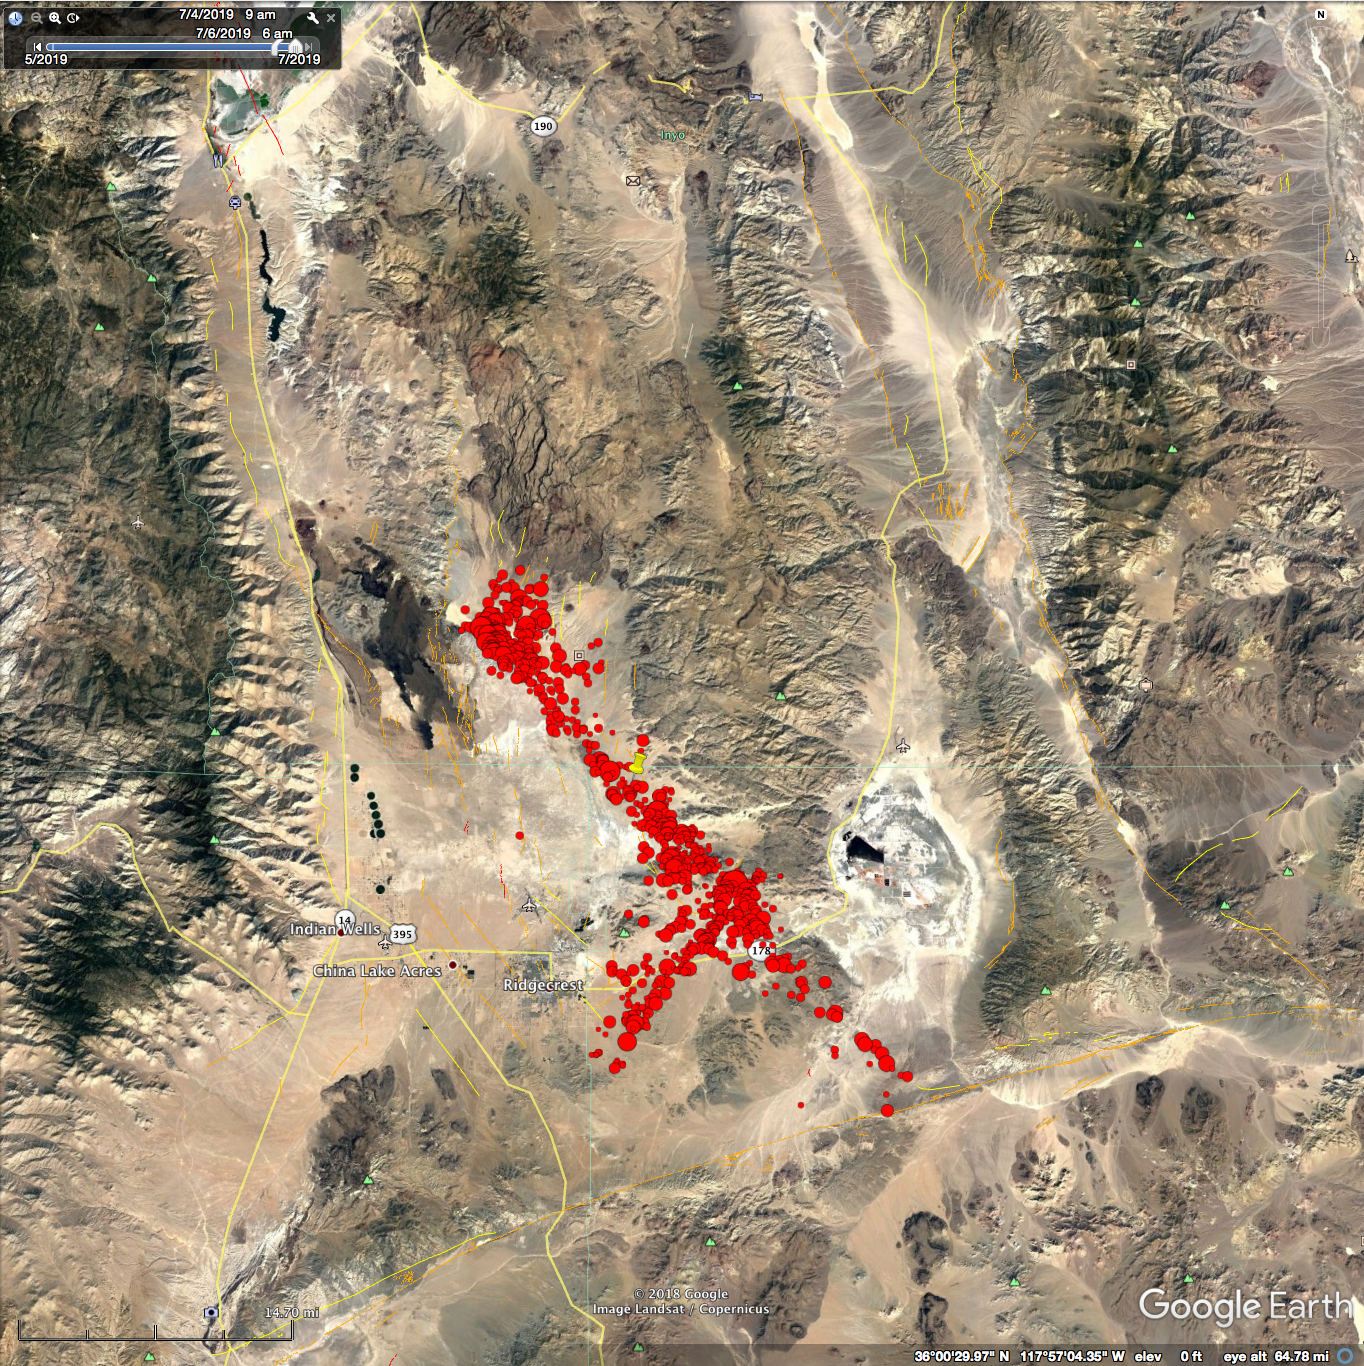
Aftershocks are occurring over a 50 km wide area, with a cluster of activity approximately 25 km NW from the mainshock about 10 km to the SE of the Coso Geothermal Field.
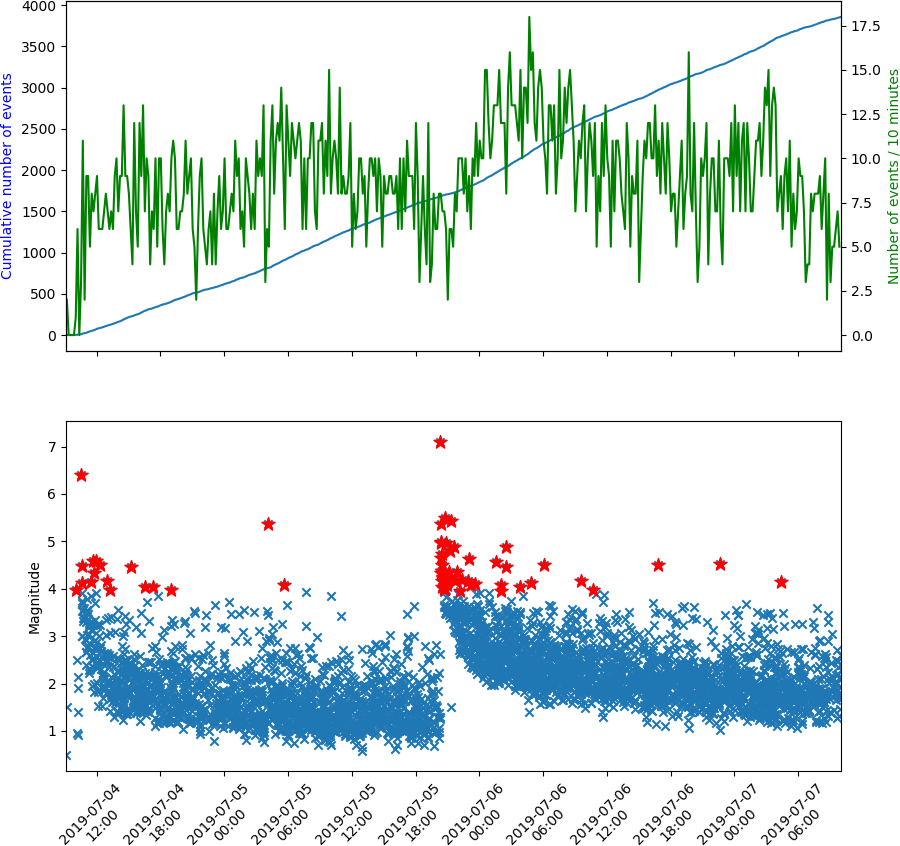
- As of 16 August 2019, 12:00PM PDT, there have been nearly 26,000 aftershocks recorded in the full sequence. This underestimates the total number of aftershocks as the processing system is still saturated with data and smaller events in particular are not all yet identified.
- Number ≥ M7: 1
- Number ≥ M6 < M7: 1
- Number ≥ M5 < M6: 5
- Number ≥ M4 < M5: 107
- Number ≥ M3 < M4: 822
- Number ≥ M2 < M3: 4202
- Aftershocks are expected to continue for months to years, but the magnitude and number will decrease through time. The largest expected is approximately 1 magnitude unit smaller than the mainshock.
- There is a small chance (about 5%) that a larger quake could occur, with the likelihood decreasing over time.
Possible Foreshocks
- There were 9 events during the 3 days prior to the earthquake (within a 10 km radius).
- The largest was M4.0 (2019/07/04, about 30 minutes prior to the M6.4).
Historical Seismicity
- Since our records began in 1932 we’ve had 31 events of M4 or greater within 10km of today’s event.
- The largest historic event was M5.8 on 1995/09/20.
- The most recent historic event was M4.1 on 01 Nov 2011.
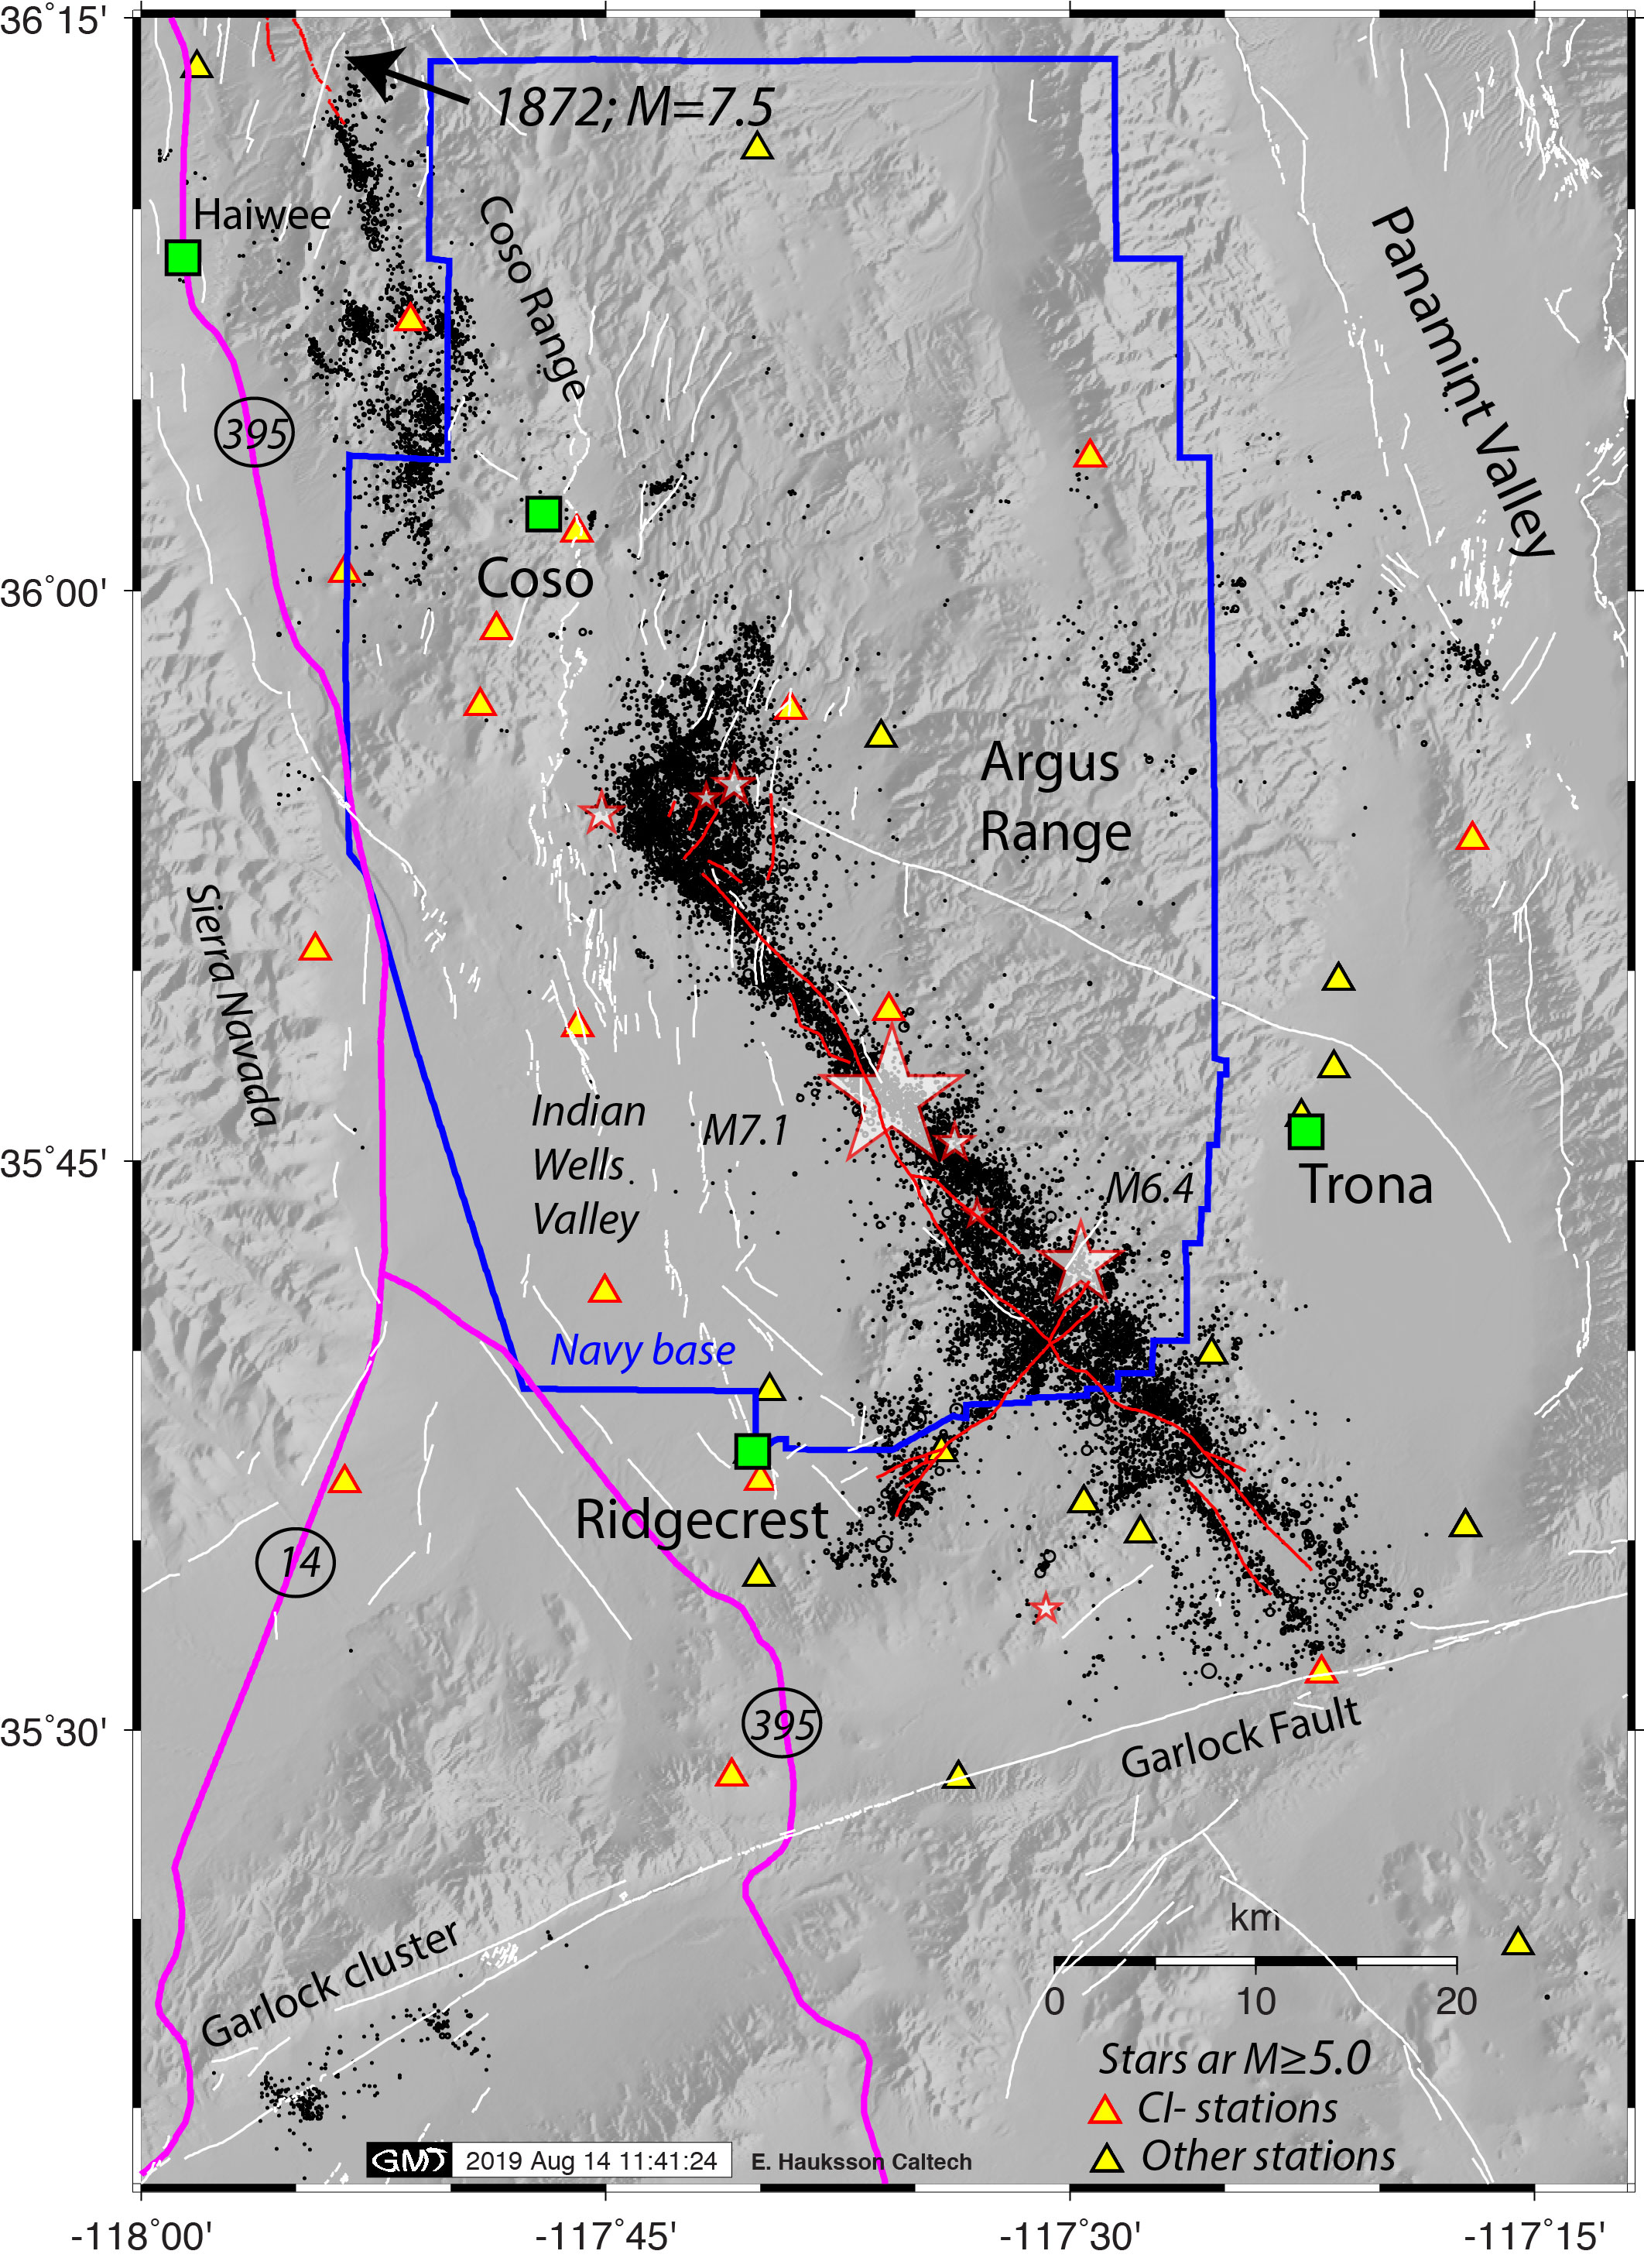
Faults
The M6.4 earthquake on 7/4/2019 appears to have broken across two faults in the Airport Lake Fault Zone. The M7.1 earthquake on 7/5/2019 appears to be on the same fault zone, and has a right-lateral strike-slip mechanism. The M7.1 epicenter is located at the NW end of NW-oriented fault involved in the M6.4 earthquake. Surface rupture had been identified from both the July 4 M6.4 and July 5 M7.1 events. For an earthquake this large, surface rupture is expected. Field teams in the Ridgecrest area are now working on documenting fault offsets in the field.
Tectonic Summary
The July 4th, 2019 Mw 6.4 earthquake in eastern California, southwest of Searles Valley, occurred as the result of shallow strike slip faulting in the crust of the North America plate. Focal mechanism solutions for the earthquake indicate rupture occurred on a steeply dipping fault as the result of either right lateral slip on a plane striking NW-SE, or as left lateral slip on a plane striking SW-NE. At the location of this earthquake, approximately 150 km northeast of San Andreas Fault – the major plate boundary in the region – the Pacific plate moves to the northwest with respect to the North America plate at a rate of approximately 48 mm/yr. The location of the earthquake falls within the Eastern California shear zone, a region of distributed faulting associated with motion across the Pacific:North America plate boundary. More detailed studies will be required to precisely identify the causative fault associated with this event.
This region of eastern California has hosted numerous moderate sized earthquakes. Over the past 40 years, 8 other M5+ earthquakes have occurred within 50 km of the July 4th, 2019 earthquake. The largest of these was a M5.8 event on September 20, 1995, about 13 km to the west-northwest of today’s event, which was felt strongly in the China Lake-Ridgecrest area, and more broadly from Los Angeles to Las Vegas. As of 1 hour after the event the July 4th, 2019 earthquake has been followed by numerous aftershocks, the largest of which was a M 4.7 earthquake 2 minutes after the M 6.4 event. Most aftershocks align in a SW-NE trend around the M 6.4 earthquake. The M 6.4 event was also preceded by a series of very small earthquakes over the previous hour, including a M 4.0 event about 30 mins earlier.
Additional Information
- Links for:
- M6.4: USGS earthquake page, ShakeMap, DYFI, waveforms.
- M7.1: USGS earthquake page, ShakeMap, DYFI, waveforms.
- Visit our special reports page for further information on local notable earthquakes.
Below is a playlist of the waveform data associated with the m6.4 and proceeding hour, as recorded in our Live Seismograms Feed. Note that the m6.4 does not appear in the feed until 35 seconds into the first video.
Below is a playlist of the waveform data associated with the m7.1 and proceeding hour, as recorded in our Live Seismograms Feed.
*Earthquakes can occur both near or on major known faults, and in places where no clear fault zones are known. Using the statistical method of Evans et al. (in prep. 2019) the location and focal mechanism of this earthquake suggest the above association with modeled faults in the Community Fault Model (CFM) provided by the Southern California Earthquake Center (SCEC) and Harvard University. Note that the CFM fault association may be different from the nearby faults list. Differences may arise due to different fault databases, and because the CFM fault association uses the hypocenter with relation to subsurface 3-dimensional fault orientation models, while the nearby faults list utilizes mapped surface traces as they relate to the epicenter.
CFM Fault: SCEC CFM 5.0 Fault name and closest segment if available; The CFM is maintained by Harvard University, Dept of Earth & Planetary Sciences.
Probability: The probability in percent the earthquake is associated with this fault.
SCSN: Caltech/USGS Southern California Seismic Network
**U.S. Geological Survey and California Geological Survey, 2006, Quaternary fault and fold database for the United States, accessed 2015, from USGS web site: https://earthquake.usgs.gov/hazards/qfaults/
This information is subject to change as more up-to-date data become available.


