Last updated August 23rd, 2023
Event
- 20 Aug 2023 14:41:00 PDT, (34.408, -119.188), depth 4.8km.
- 7km SE of Ojai, California
Aftershocks
- As of 23 Aug 2023, 07:39AM PDT, there have been 172 aftershocks recorded with the following totals by magnitude for this sequence:
- 6>M≥5: 1
- 5>M≥4: 0
- 4>M≥3: 12
- 3>M≥2: 55
- The largest aftershock was M3.9 (smallest M1.0).
- More aftershocks may be expected in the next few days, the largest expected is approximately 1 magnitude unit smaller than the mainshock.
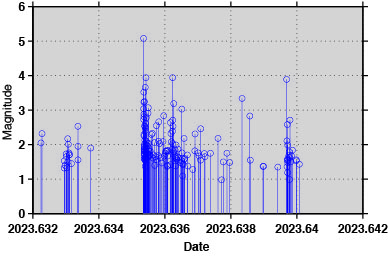
This magnitude stick plot shows the episodic time evolution of the sequence. Note that the M3.9 on 2023/08/22 had its own aftershock sequence.
- There is a small chance (about 5%) that a larger quake could occur, with the likelihood decreasing over time.
Possible Foreshocks
- There were 19 events during the 3 days prior to the earthquake (within a 10 km radius).
- The largest was M2.6 (2023/08/20).
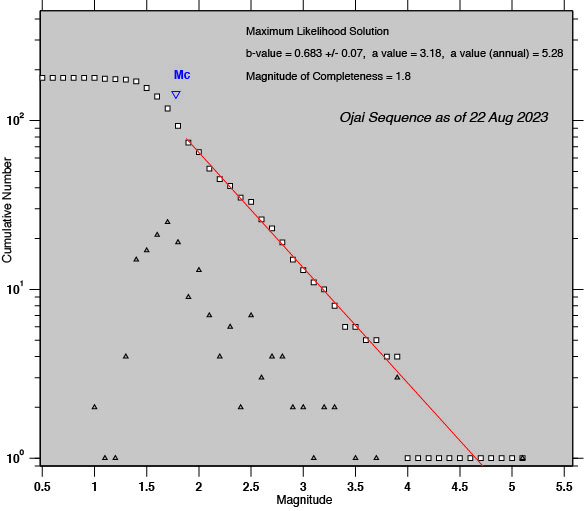
This b-value plot shows a b-value of 0.68, which is unusually small. On average the b-value for southern California is approx. 1.0. This small b-value suggests that these earthquakes are occurring in an environment with above average tectonic stress, which is driving the large number of M3+ aftershocks.
Seismic observations provided by Egill Hauksson, Caltech. With consultation by Hiroo Kanamori, Caltech.
These interpretations may change, SCSN data are still preliminary, and the locations/ magnitudes may change as event analysis continues.
- The sequence started 2023/08/19 at 18:27 with 19 recorded foreshocks (M 1.3 – 2.5) on a north-northeast trend located in the southern corner of the aftershock distribution.
- The mainshock occurred on 2023/8/20 at 21:41, 26 hours after the sequence started, at a depth of 5.5 km. The moment tensor (see map plot) shows mixed strike-slip and thrust faulting on the northeast striking nodal plane, which is most likely the fault plane. However, the moment tensor has a 70% non-double component suggesting a non-planar fault. This is confirmed with longer-period w-phase solutions. Hypocenter alignments within the depth distribution of the aftershocks also suggest the presence of additional fault planes with different orientation. These details of the faulting will be worked out in future studies.
- As of 2023/8/21 20:00 a total of 120 aftershocks have been recorded, with two largest events of M3.9. The whole sequence occurred mostly in the depth range from 4.0 to 6.5 km depth.
- Associating this sequence to a fault is not easy although numerous active faults are mapped in the region. For instance, the sequence crosses the Lion Canyon Fault at an oblique angle, and does not seem to trigger aftershocks along it. There are some short northeast striking faults in the wider area but these tend to be discontinuous and unnamed.
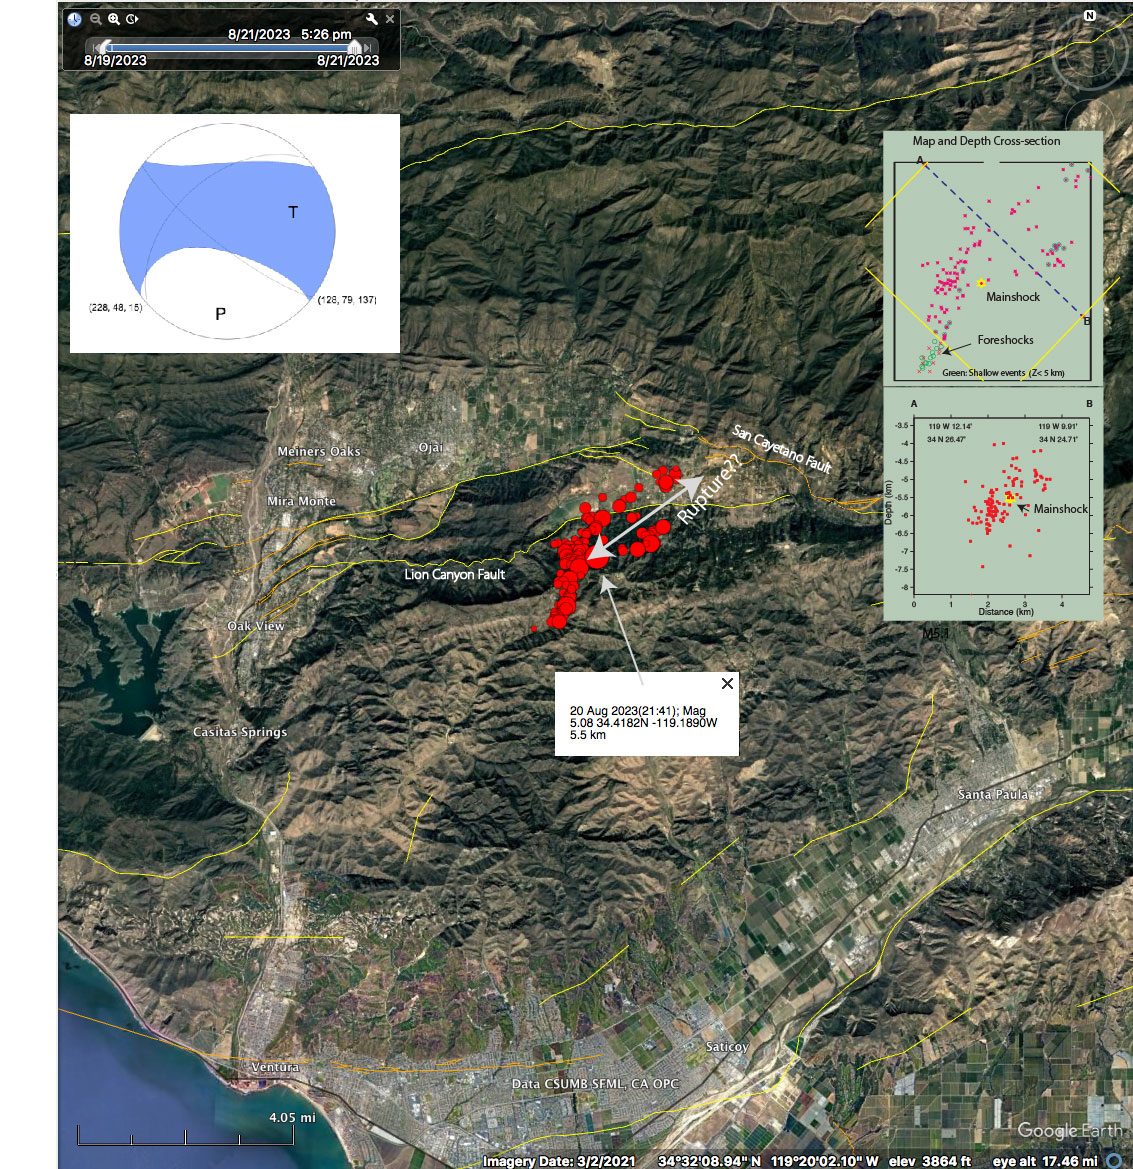
The map and cross section show a steep west dip in the south, and shallower northwest dip to the north of the mainshock hypocenter. Events within the yellow square in the map are projected onto the A-B cross section.
3D Graphical observations and Community Fault Model (CFM) images provided by Craig Nicholson, UCSB.
Viewing the analyzed hypocenters from the sequence in 3D and comparing them to the 3D faults in the CFM, the sequence is primarily between the Sisar and Arroyo Parida S-dipping faults.
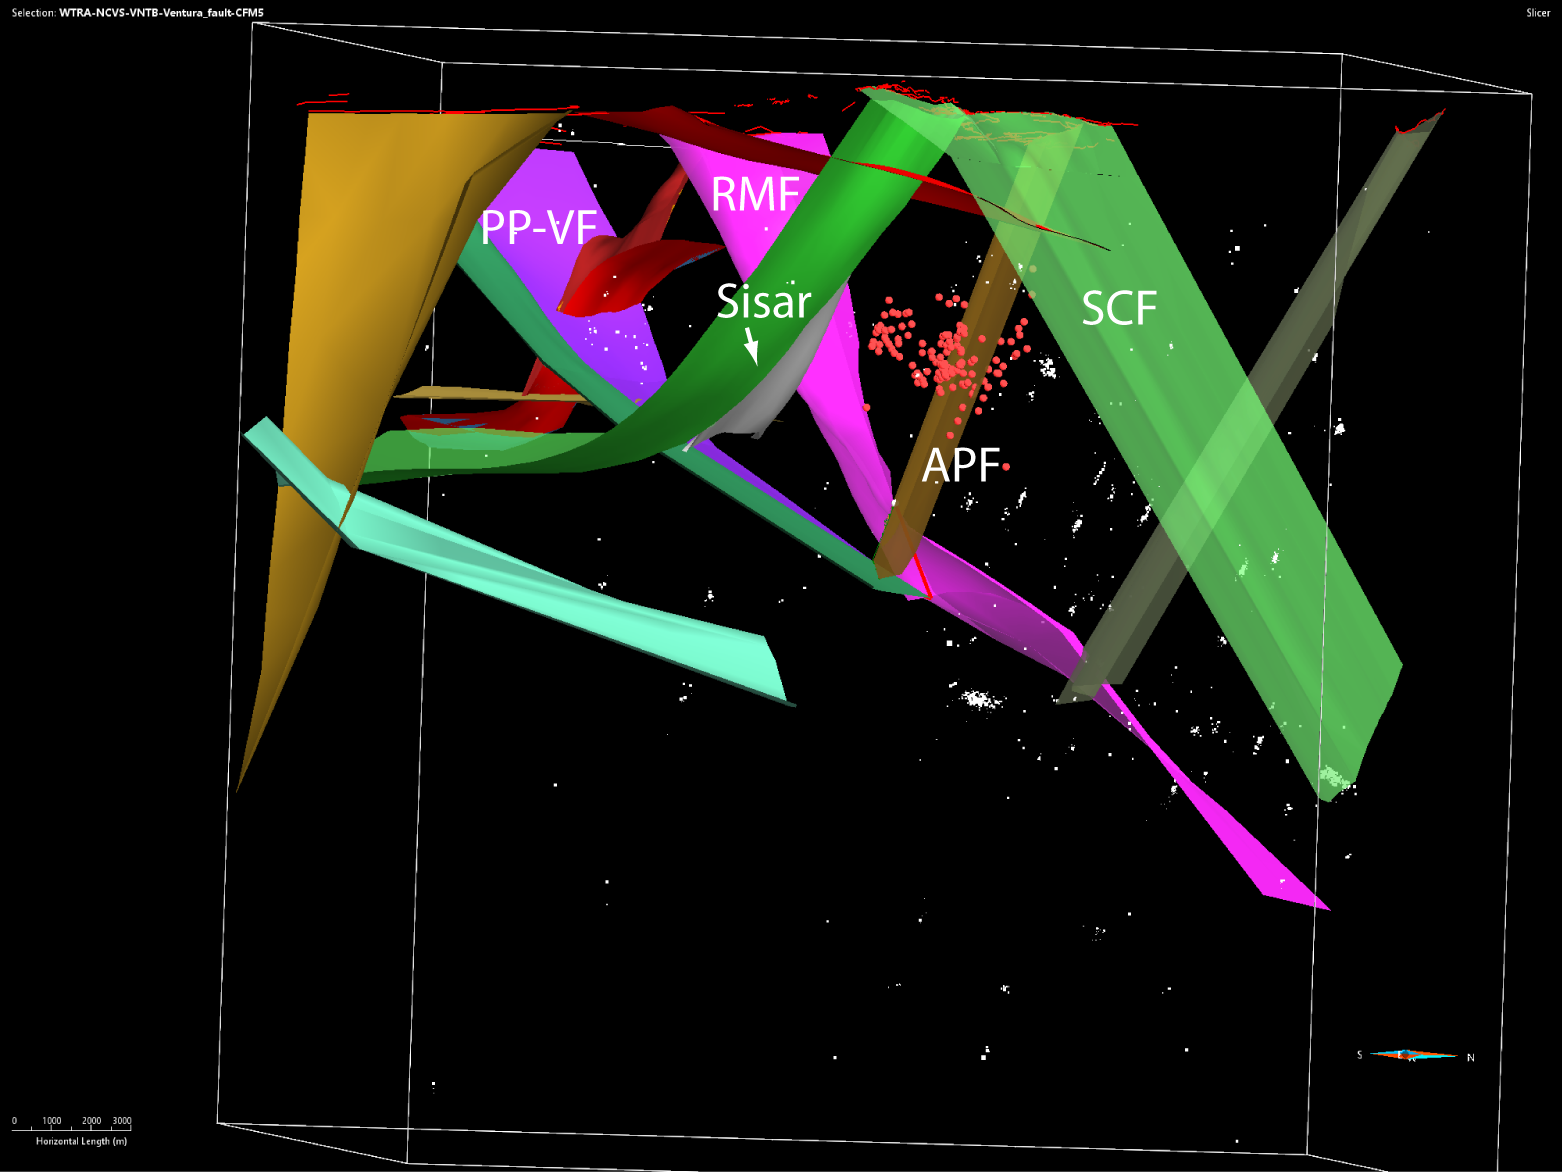
View of M5.1 Ojai sequence events and surrounding CFM faults along strike (to the west) of the Arroyo Parida Fault.
Orange spheres – Ojai sequence events; APF – Arroyo Parida; SCF – San Cayetano;
SSCF – Southern San Cayetano; RMF – Red Mountain; PP-VF – Pitas Point-Ventura;
White dots – Historic seismicity from QTM catalog.
Lion Canyon fault was removed from images for view clarity.
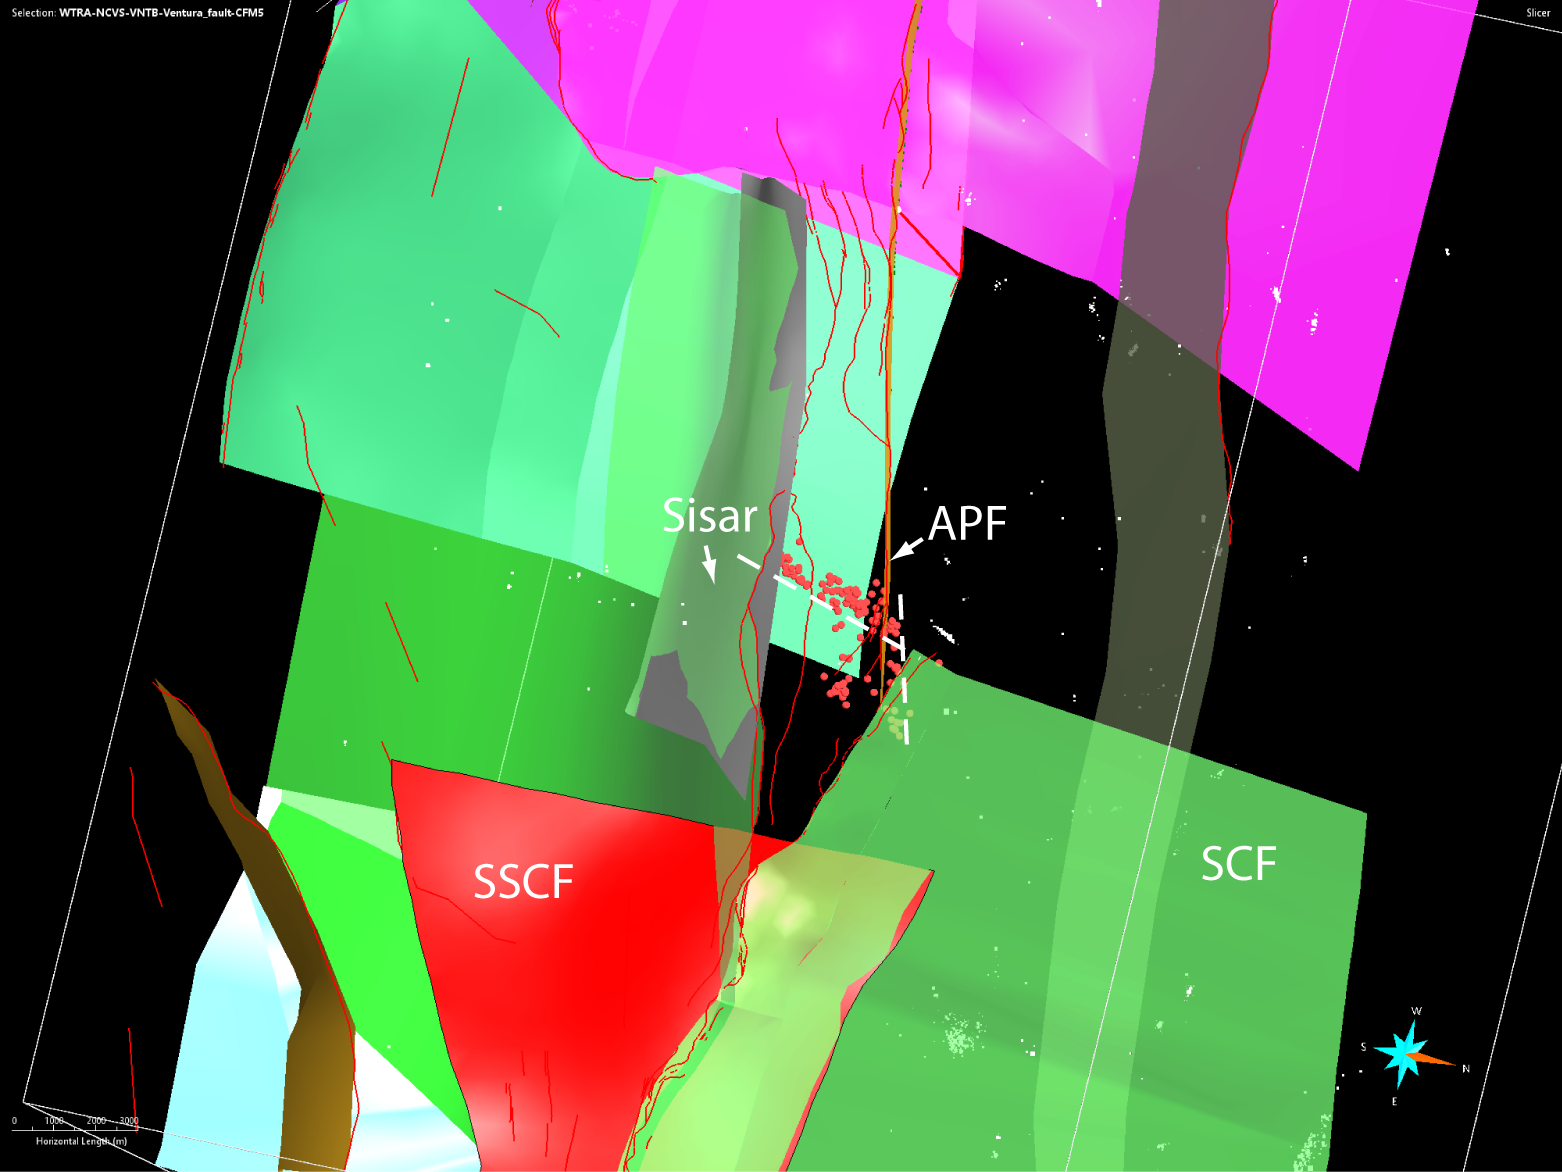
View of M5.1 Ojai sequence events and surrounding CFM faults rotated to view downdip in the plane(s) of slip of the aftershock sequence.
However, rotating the frame of reference to look downdip in the plane(s) of slip that seem to be defined by the aftershocks, it looks like, as with earlier observations, that the primary rupture is on a fairly steeply dipping secondary cross fault that dips west and south in the footwall of the Sisar fault system, with a possible nearly orthogonal secondary slip along the APF (dashed lines).
Historical Seismicity
- Since our records began in 1932 we’ve had 5 events of M4 or greater within 10km of today’s event.
- The largest historic event was M4.3 on 1954/11/17.
- The most recent historic event was M4.1 on 12 Mar 2016.
Additional Information
- Links for: USGS earthquake page, ShakeMap, DYFI
- Visit our special reports page for further information on local notable earthquakes.
- Visit scedc.caltech.edu to access any data recorded by the SCSN.
Below are the waveform data associated with this event, as recorded in our Live Seismograms Feed.
*Earthquakes can occur both near or on major known faults, and in places where no clear fault zones are known. Using the statistical method of Evans et al. (in prep. 2019) the location and focal mechanism of this earthquake suggest the above association with modeled faults in the Community Fault Model (CFM) provided by the Southern California Earthquake Center (SCEC) and Harvard University. Note that the CFM fault association may be different from the nearby faults list. Differences may arise due to different fault databases, and because the CFM fault association uses the hypocenter with relation to subsurface 3-dimensional fault orientation models, while the nearby faults list utilizes mapped surface traces as they relate to the epicenter.
CFM Fault: SCEC CFM 5.0 Fault name and closest segment if available; The CFM is maintained by Harvard University, Dept of Earth & Planetary Sciences.
Probability: The probability in percent the earthquake is associated with this fault.
SCSN: Caltech/USGS Southern California Seismic Network
**U.S. Geological Survey and California Geological Survey, 2006, Quaternary fault and fold database for the United States, accessed 2015, from USGS web site: https://earthquake.usgs.gov/hazards/qfaults/
This information is subject to change as more up-to-date data become available.


