Last updated October 4th, 2019
- 29 Dec 2015 17:48:57 PST, (34.192, -117.413), depth 7.0km, 4km SSW of Devore, California
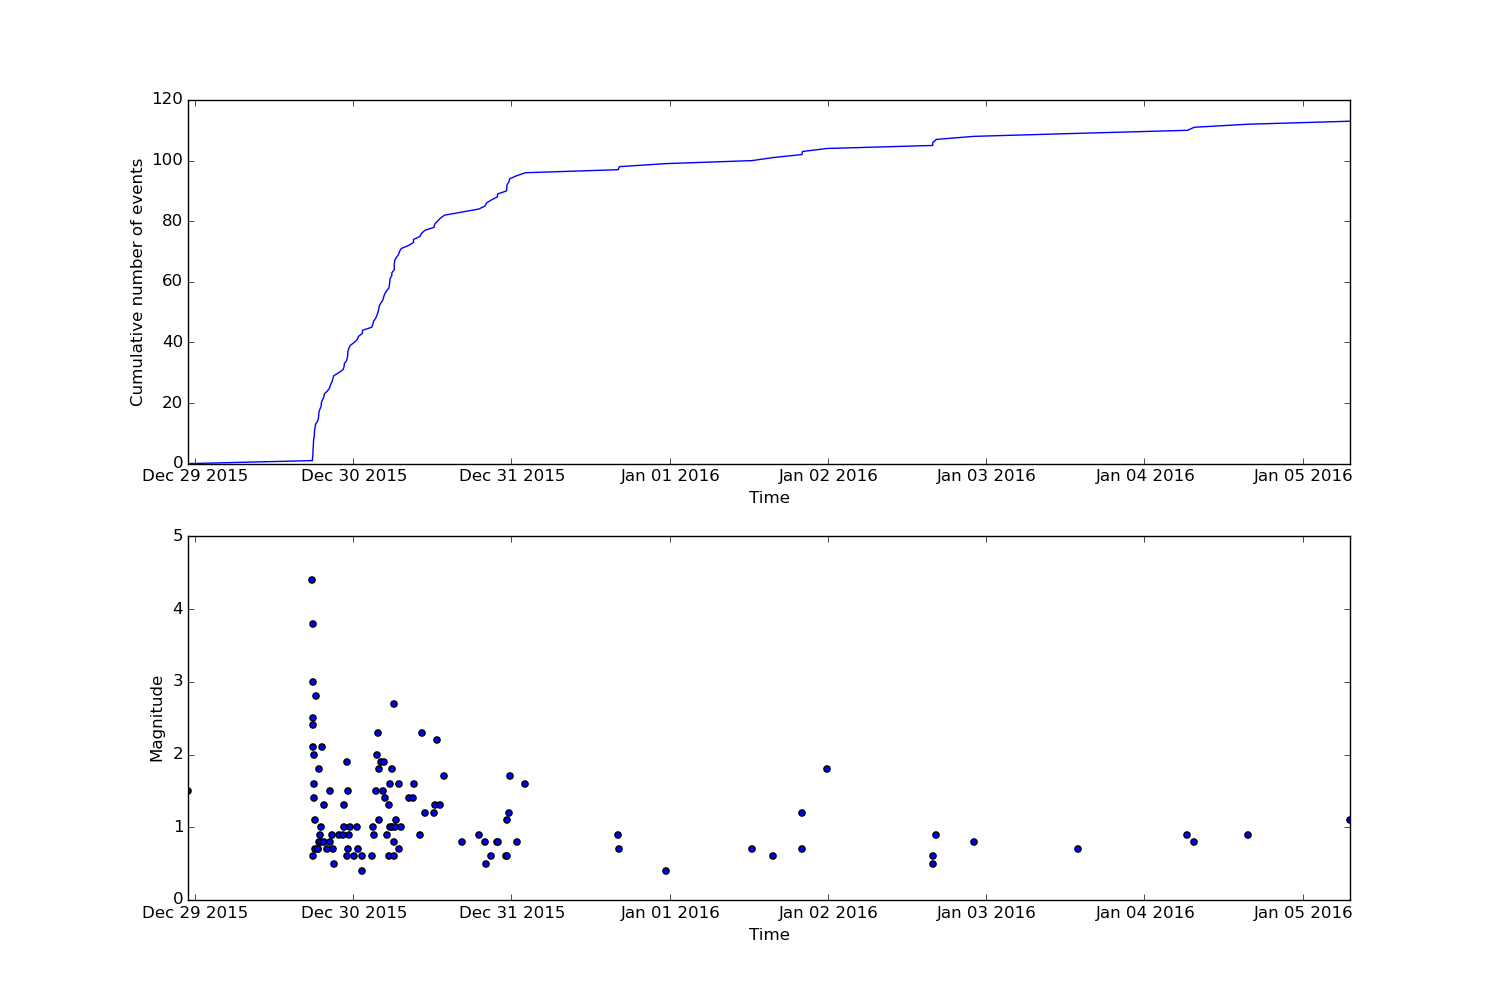
- Aftershocks: so far (06 Jan 2016, 07:44PM PST) there have been 112 aftershocks recorded, the largest M3.8. More may be expected in the next few days, the largest expected is approximately 1 magnitude unit smaller than the mainshock. There is a small chance (about 5%) that a larger quake could occur, with the likelihood decreasing over time.
- There was 1 event during the 3 days prior to the earthquake (within a 1 km radius), with magnitude M1.4 (2015/12/29).
- The figure shows the cumulative event rate as well as magnitude against time for the sequence.
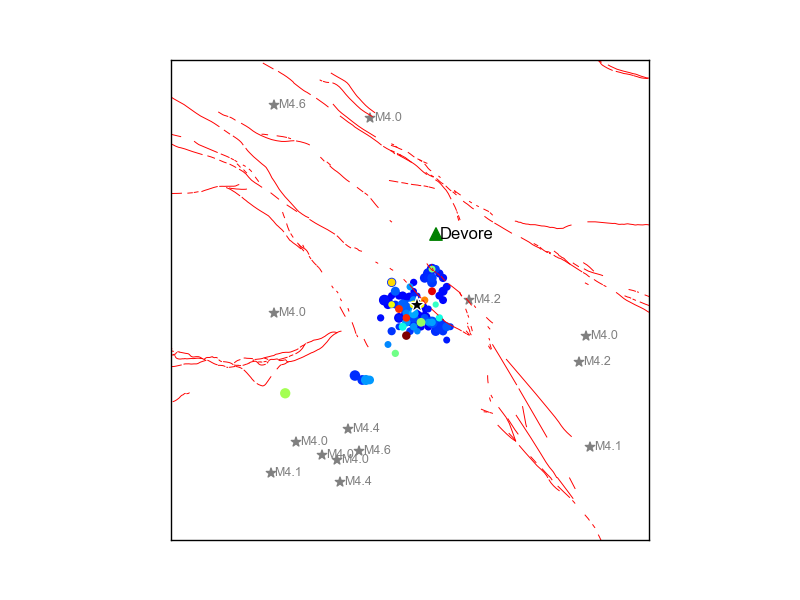
- Historical seismicity: since our records began in 1932 we’ve had 10 events of M4 or greater within 10km of today’s event, the largest was M4.6 (1965/04/15) and the most recent was M4.4 on 15 Jan 2014.
- The figure shows the historic seismicity as grey stars and the recent sequence as circles, coloured by the time of occurrence (blue early, red late) and sized by magnitude. The main M4.4 event is shown as a black star. Red lines indicate the fault traces and the town of Devore is marked by a green triangle.
- The event occurred in a geologically complex area, at the junction of a number of major fault strands (the San Andreas, San Jacinto and Cucamonga). The focal mechanism is more consistent with motions on the San Andreas and San Jacinto.
- Nearby faults: San Jacinto fault zone (0.4 km), Sierra Madre fault zone, Cucamonga section (Cucamonga fault) (2.8 km), San Andreas fault zone, San Bernardino Mountains section (Tokay Hill fault) (3.8 km), Waterman Canyon fault zone (Waterman Canyon fault) (5.1 km), Red Hill-Etiwanda Avenue fault (Etiwanda Avenue fault) (9.6 km), Cleghorn fault zone, southern Cleghorn section (Cleghorn fault) (10.3 km), San Gabriel fault zone, San Gabriel River section (San Gabriel fault) (13.2 km).
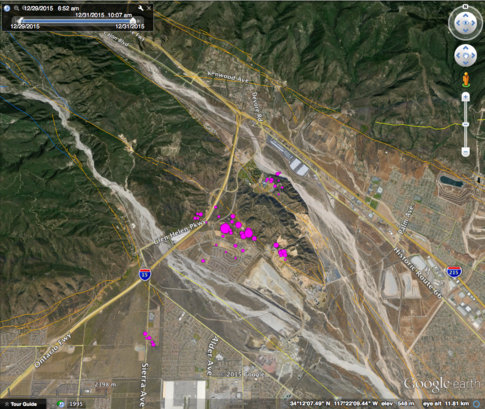
- Preliminary relocations for events in the sequence are shown in the figure below, indicating one larger and two small adjacent clusters. All three are associated with adjacent segments of the San Jacinto fault. (Prepared by Egill Hauksson.)
- Links for: USGS earthquake page, ShakeMap, DYFI.
- Visit our special reports page for further information on local notable earthquakes.